Created
: 2025.08.06


![]() 2025.08.06 18:06
2025.08.06 18:06
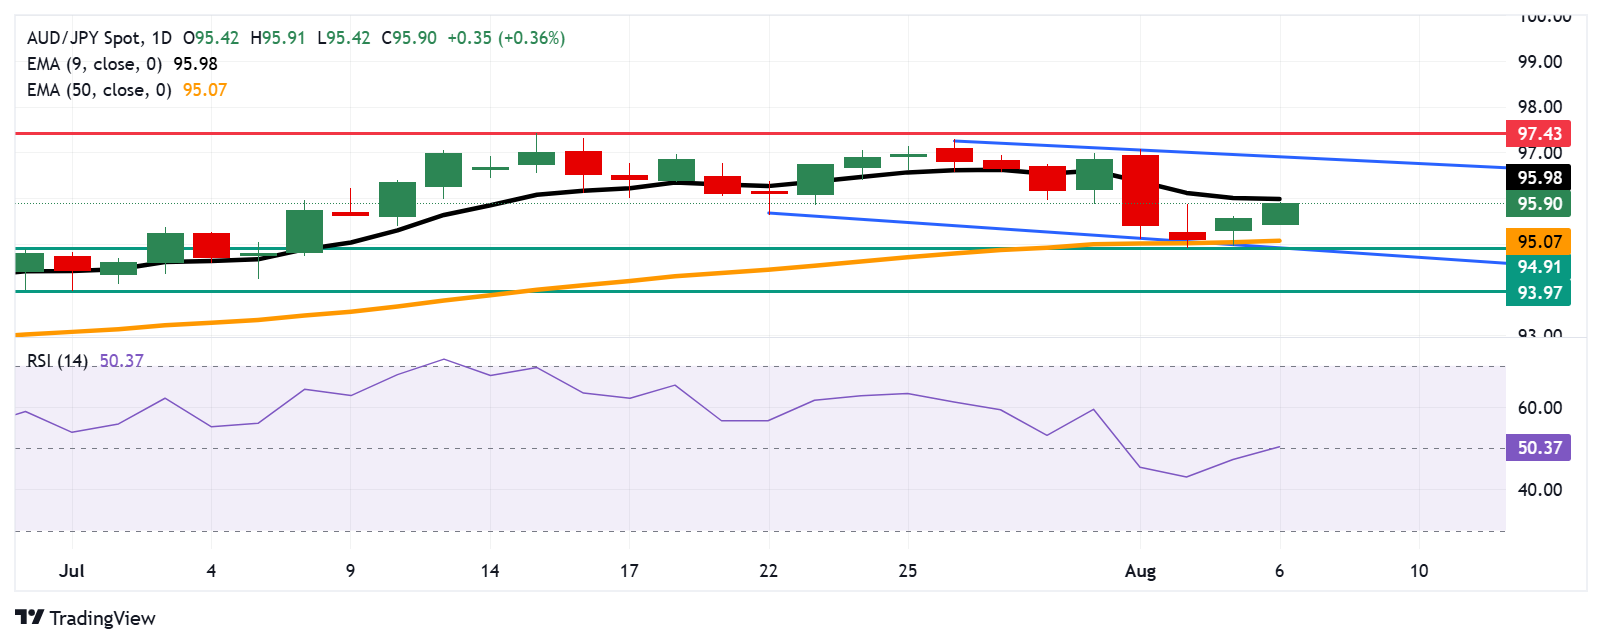
AUD/JPY continues to gain ground for the second successive day, trading around 95.90 during the European hours on Wednesday. The technical analysis of the daily chart shows that the currency cross remains within the descending channel pattern, suggesting a prevailing bearish bias.
Additionally, the AUD/JPY cross remains below the nine-day Exponential Moving Average (EMA), indicating short-term price momentum is weaker. However, the 14-day Relative Strength Index (RSI) is positioned on the 50 mark, indicating a neutral market sentiment. Further movements will offer a clear directional trend.
The AUD/JPY cross may find initial support at the 50-day EMA of 95.07, followed by the monthly low at 94.91, which is aligned with the lower boundary of the descending channel. A successful break below this crucial support zone would strengthen the bearish bias and put downward pressure on the currency cross to navigate the region around the two-month low at 93.97, which was recorded on July 1.
On the upside, the AUD/JPY cross tests the nine-day EMA at 95.98, aligned with the psychological level of 96.00. A break above this level would improve the short-term price momentum and support the pair to approach the descending channel's upper boundary around 96.90. Further advances would cause the emergence of the bullish bias and prompt the currency cross to target the seven-month high at 97.43, which was recorded on July 15.
The table below shows the percentage change of Australian Dollar (AUD) against listed major currencies today. Australian Dollar was the strongest against the Japanese Yen.
| USD | EUR | GBP | JPY | CAD | AUD | NZD | CHF | |
|---|---|---|---|---|---|---|---|---|
| USD | -0.00% | 0.12% | 0.16% | -0.03% | -0.38% | -0.21% | 0.12% | |
| EUR | 0.00% | 0.10% | 0.17% | -0.03% | -0.28% | -0.25% | 0.12% | |
| GBP | -0.12% | -0.10% | 0.06% | -0.13% | -0.40% | -0.38% | 0.07% | |
| JPY | -0.16% | -0.17% | -0.06% | -0.20% | -0.57% | -0.48% | 0.02% | |
| CAD | 0.03% | 0.03% | 0.13% | 0.20% | -0.25% | -0.24% | 0.20% | |
| AUD | 0.38% | 0.28% | 0.40% | 0.57% | 0.25% | 0.03% | 0.46% | |
| NZD | 0.21% | 0.25% | 0.38% | 0.48% | 0.24% | -0.03% | 0.44% | |
| CHF | -0.12% | -0.12% | -0.07% | -0.02% | -0.20% | -0.46% | -0.44% |
The heat map shows percentage changes of major currencies against each other. The base currency is picked from the left column, while the quote currency is picked from the top row. For example, if you pick the Australian Dollar from the left column and move along the horizontal line to the US Dollar, the percentage change displayed in the box will represent AUD (base)/USD (quote).
![]()
Created
: 2025.08.06
![]()
Last updated
: 2025.08.06

FXStreet is a forex information website, delivering market analysis and news articles 24/7.
It features a number of articles contributed by well-known analysts, in addition to the ones by its editorial team.
Founded in 2000 by Francesc Riverola, a Spanish economist, it has grown to become a world-renowned information website.
We hope you find this article useful. Any comments or suggestions will be greatly appreciated.
We are also looking for writers with extensive experience in forex and crypto to join us.
please contact us at [email protected].
Disclaimer:![]()
All information and content provided on this website is provided for informational purposes only and is not intended to solicit any investment. Although all efforts are made in order to ensure that the information is correct, no guarantee is provided for the accuracy of any content on this website. Any decision made shall be the responsibility of the investor and Myforex does not take any responsibility whatsoever regarding the use of any information provided herein.
The content provided on this website belongs to Myforex and, where stated, the relevant licensors. All rights are reserved by Myforex and the relevant licensors, and no content of this website, whether in full or in part, shall be copied or displayed elsewhere without the explicit written permission of the relevant copyright holder. If you wish to use any part of the content provided on this website, please ensure that you contact Myforex.
Myforex uses cookies to improve the convenience and functionality of this website. This website may include cookies not only by us but also by third parties (advertisers, log analysts, etc.) for the purpose of tracking the activities of users. Cookie policy
