Created
: 2025.08.12


![]() 2025.08.12 21:05
2025.08.12 21:05
Gold (XAU/USD) steadies on Tuesday after slipping to a one-week low on the previous day. At the time of writing, the precious metal is consolidating near $3,345 during European trading hours, with investors awaiting the release of the US inflation data at 12:30 GMT for fresh monetary policy cues.
The metal showed signs of stabilization after US President Donald Trump announced on Monday, via his social media platform Truth Social, that Gold imports would be exempt from new US tariffs.
The proposed tariffs could have applied to widely traded Swiss Gold bars, including 1-kilogram and 100-ounce bars, creating uncertainty in the bullion market and raising concerns over potential supply chain disruptions. The clarification eased market jitters, but investors are still awaiting a formal executive order to definitively clarify the administration's tariff policy.
Attention now turns to the US Consumer Price Index (CPI) data for July, which will be watched closely for signs that new tariffs are starting to filter through to inflation. Headline CPI is expected to increase 0.2% MoM, easing from 0.3% in June. On an annual basis, the inflation rate is expected to have accelerated for a third consecutive month to 2.8% from 2.7% in June.
Core CPI, which excludes food and energy -- a key measure of core inflation -- is expected to show a 0.3% monthly increase, up from 0.2% in June, while the annual core rate is forecast at 3%, up slightly from 2.9%.
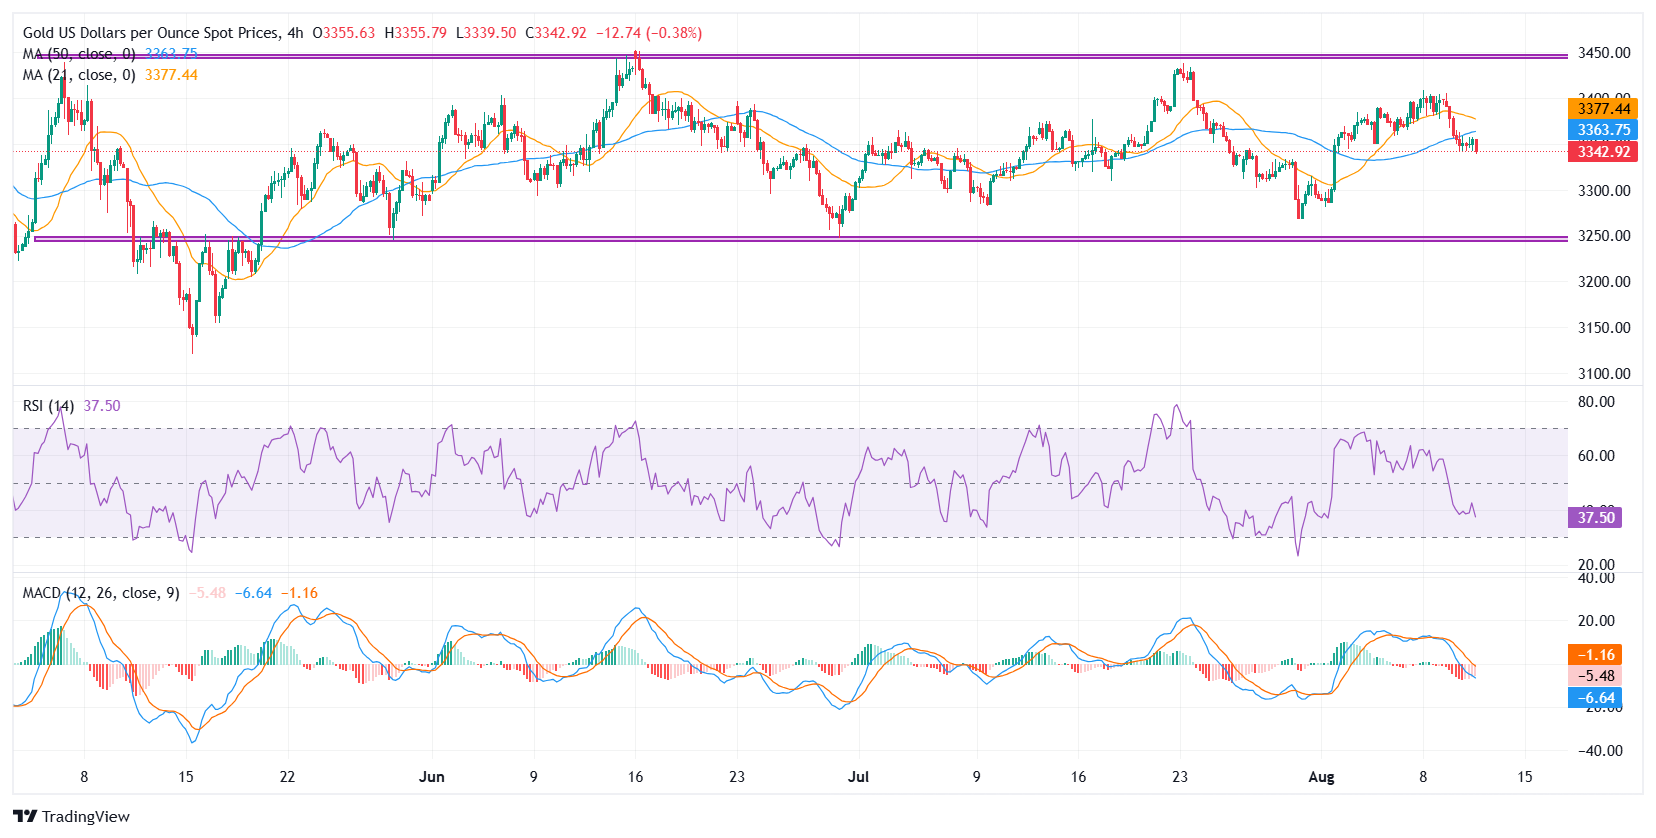
Gold (XAU/USD) has been consolidating in a well-defined horizontal range between $3,450 and $3,250 since mid-April, after peaking at an all-time high of $3,500 earlier that month.
Price action on the 4-hour chart shows repeated failures to sustain gains above the $3,400 psychological barrier, with the most recent rejection last week reinforcing this level as a strong supply zone.
The 21-period SMA ($3,377) has begun to slope lower and is showing early signs of converging with the 50-period SMA ($3,363), reflecting waning upside momentum. With price trading below both moving averages, the short-term bias remains tilted to the downside unless a soft US CPI print sparks a rebound.
The Relative Strength Index (RSI) is hovering around 37, pointing to growing downside momentum but not yet in oversold territory, leaving room for further declines. The Moving Average Convergence Divergence (MACD) indicator remains in negative territory, with both the MACD line and signal line below zero, accompanied by a bearish crossover, confirming the momentum shift toward sellers.
Immediate resistance is seen at $3,363 (50-SMA), followed by $3,377 (21-SMA) and the $3,400 psychological barrier. On the downside, initial support lies at $3,330-$3,320, with a break below exposing the range floor at $3,250. Further weakness could bring the next major support at $3,000 into focus.
Inflationary or deflationary tendencies are measured by periodically summing the prices of a basket of representative goods and services and presenting the data as The Consumer Price Index (CPI). CPI data is compiled on a monthly basis and released by the US Department of Labor Statistics. The YoY reading compares the prices of goods in the reference month to the same month a year earlier.The CPI is a key indicator to measure inflation and changes in purchasing trends. Generally speaking, a high reading is seen as bullish for the US Dollar (USD), while a low reading is seen as bearish.
Read more.Next release: Tue Aug 12, 2025 12:30
Frequency: Monthly
Consensus: 2.8%
Previous: 2.7%
Source: US Bureau of Labor Statistics
The US Federal Reserve (Fed) has a dual mandate of maintaining price stability and maximum employment. According to such mandate, inflation should be at around 2% YoY and has become the weakest pillar of the central bank's directive ever since the world suffered a pandemic, which extends to these days. Price pressures keep rising amid supply-chain issues and bottlenecks, with the Consumer Price Index (CPI) hanging at multi-decade highs. The Fed has already taken measures to tame inflation and is expected to maintain an aggressive stance in the foreseeable future.
![]()
Created
: 2025.08.12
![]()
Last updated
: 2025.08.12

FXStreet is a forex information website, delivering market analysis and news articles 24/7.
It features a number of articles contributed by well-known analysts, in addition to the ones by its editorial team.
Founded in 2000 by Francesc Riverola, a Spanish economist, it has grown to become a world-renowned information website.
We hope you find this article useful. Any comments or suggestions will be greatly appreciated.
We are also looking for writers with extensive experience in forex and crypto to join us.
please contact us at [email protected].
Disclaimer:![]()
All information and content provided on this website is provided for informational purposes only and is not intended to solicit any investment. Although all efforts are made in order to ensure that the information is correct, no guarantee is provided for the accuracy of any content on this website. Any decision made shall be the responsibility of the investor and Myforex does not take any responsibility whatsoever regarding the use of any information provided herein.
The content provided on this website belongs to Myforex and, where stated, the relevant licensors. All rights are reserved by Myforex and the relevant licensors, and no content of this website, whether in full or in part, shall be copied or displayed elsewhere without the explicit written permission of the relevant copyright holder. If you wish to use any part of the content provided on this website, please ensure that you contact Myforex.
Myforex uses cookies to improve the convenience and functionality of this website. This website may include cookies not only by us but also by third parties (advertisers, log analysts, etc.) for the purpose of tracking the activities of users. Cookie policy
