Created
: 2025.07.21


![]() 2025.07.21 20:37
2025.07.21 20:37
Gold price (XAU/USD) advances to near $3.370 during the European trading session on Monday. The precious metal gains as the US Dollar (USD) corrects after failing to extend its recent upside move. Technically, lower US Dollar makes the Gold price an attractive bet for investors.
At the time of writing, the US Dollar Index (DXY), which tracks the Greenback's value against six major currencies, retraces to near 98.15 from the four-week high around 99.00.
The table below shows the percentage change of US Dollar (USD) against listed major currencies today. US Dollar was the weakest against the British Pound.
| USD | EUR | GBP | JPY | CAD | AUD | NZD | CHF | |
|---|---|---|---|---|---|---|---|---|
| USD | -0.25% | -0.38% | -0.24% | -0.07% | -0.04% | 0.10% | -0.24% | |
| EUR | 0.25% | -0.06% | 0.02% | 0.16% | 0.17% | 0.16% | -0.03% | |
| GBP | 0.38% | 0.06% | -0.14% | 0.27% | 0.26% | 0.44% | 0.23% | |
| JPY | 0.24% | -0.02% | 0.14% | 0.18% | 0.23% | 0.28% | 0.17% | |
| CAD | 0.07% | -0.16% | -0.27% | -0.18% | 0.09% | 0.17% | -0.22% | |
| AUD | 0.04% | -0.17% | -0.26% | -0.23% | -0.09% | 0.07% | -0.07% | |
| NZD | -0.10% | -0.16% | -0.44% | -0.28% | -0.17% | -0.07% | -0.22% | |
| CHF | 0.24% | 0.03% | -0.23% | -0.17% | 0.22% | 0.07% | 0.22% |
The heat map shows percentage changes of major currencies against each other. The base currency is picked from the left column, while the quote currency is picked from the top row. For example, if you pick the US Dollar from the left column and move along the horizontal line to the Japanese Yen, the percentage change displayed in the box will represent USD (base)/JPY (quote).
The US Dollar faces selling pressure even though traders see a lesser chance that the Federal Reserve (Fed) will cut interest rates in the policy meeting in September. According to the CME FedWatch tool, the probability for the Fed to reduce interest rates in the September meeting has declined to 58.5% from almost 70% seen a month ago. The tool also shows that the Fed will leave borrowing rates steady in the policy meeting scheduled for next week.
Traders pare Fed dovish bets after the release of the United States (US) Consumer Price Index (CPI) data for June, which showed that the impact of sectoral tariffs imposed by President Donald Trump has started flowing into prices.
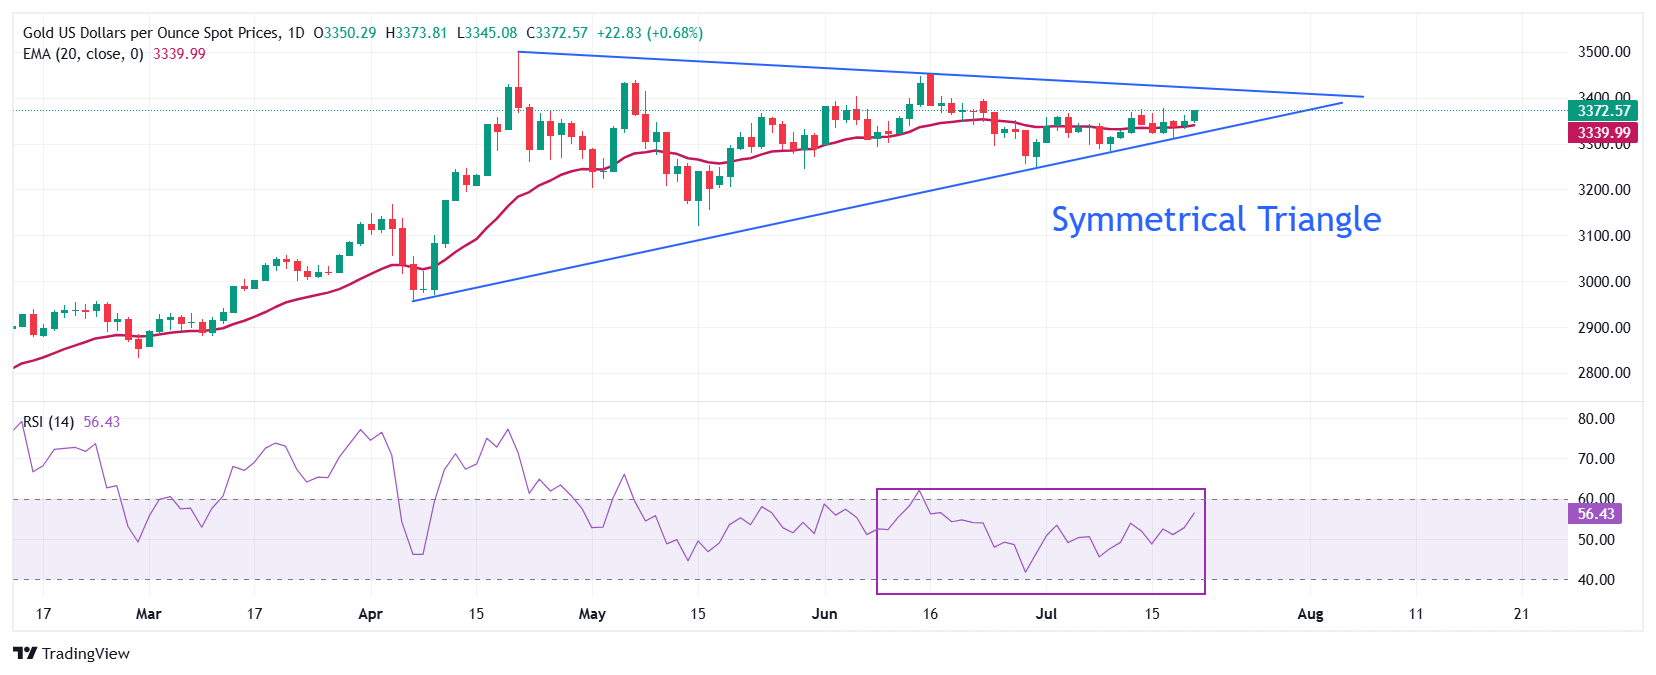
Gold price trades in a Symmetrical Triangle formation on a daily timeframe, which indicates a volatility contraction. The upward-sloping trendline of the above-mentioned chart pattern is placed from the May 15 low of $3,120.83, while its downward-sloping border is plotted from the April 22 high around $3,500
The 20-day Exponential Moving Average (EMA) around $3,340 acts as a key support area for the Gold price.
The 14-day Relative Strength Index (RSI) oscillates inside the 40.00-60.00 range, indicating a sideways trend.
Looking up, the Gold price will enter in an unchartered territory if it breaks above the psychological level of $3,500 decisively. Potential resistances would be $3,550 and $3,600.
Alternatively, the Gold price would fall towards the round-level support of $3,200 and the May 15 low at $3,121, if it breaks below the May 29 low of $3,245
Gold has played a key role in human's history as it has been widely used as a store of value and medium of exchange. Currently, apart from its shine and usage for jewelry, the precious metal is widely seen as a safe-haven asset, meaning that it is considered a good investment during turbulent times. Gold is also widely seen as a hedge against inflation and against depreciating currencies as it doesn't rely on any specific issuer or government.
Central banks are the biggest Gold holders. In their aim to support their currencies in turbulent times, central banks tend to diversify their reserves and buy Gold to improve the perceived strength of the economy and the currency. High Gold reserves can be a source of trust for a country's solvency. Central banks added 1,136 tonnes of Gold worth around $70 billion to their reserves in 2022, according to data from the World Gold Council. This is the highest yearly purchase since records began. Central banks from emerging economies such as China, India and Turkey are quickly increasing their Gold reserves.
Gold has an inverse correlation with the US Dollar and US Treasuries, which are both major reserve and safe-haven assets. When the Dollar depreciates, Gold tends to rise, enabling investors and central banks to diversify their assets in turbulent times. Gold is also inversely correlated with risk assets. A rally in the stock market tends to weaken Gold price, while sell-offs in riskier markets tend to favor the precious metal.
The price can move due to a wide range of factors. Geopolitical instability or fears of a deep recession can quickly make Gold price escalate due to its safe-haven status. As a yield-less asset, Gold tends to rise with lower interest rates, while higher cost of money usually weighs down on the yellow metal. Still, most moves depend on how the US Dollar (USD) behaves as the asset is priced in dollars (XAU/USD). A strong Dollar tends to keep the price of Gold controlled, whereas a weaker Dollar is likely to push Gold prices up.
![]()
Created
: 2025.07.21
![]()
Last updated
: 2025.07.21

FXStreet is a forex information website, delivering market analysis and news articles 24/7.
It features a number of articles contributed by well-known analysts, in addition to the ones by its editorial team.
Founded in 2000 by Francesc Riverola, a Spanish economist, it has grown to become a world-renowned information website.
We hope you find this article useful. Any comments or suggestions will be greatly appreciated.
We are also looking for writers with extensive experience in forex and crypto to join us.
please contact us at [email protected].
Disclaimer:![]()
All information and content provided on this website is provided for informational purposes only and is not intended to solicit any investment. Although all efforts are made in order to ensure that the information is correct, no guarantee is provided for the accuracy of any content on this website. Any decision made shall be the responsibility of the investor and Myforex does not take any responsibility whatsoever regarding the use of any information provided herein.
The content provided on this website belongs to Myforex and, where stated, the relevant licensors. All rights are reserved by Myforex and the relevant licensors, and no content of this website, whether in full or in part, shall be copied or displayed elsewhere without the explicit written permission of the relevant copyright holder. If you wish to use any part of the content provided on this website, please ensure that you contact Myforex.
Myforex uses cookies to improve the convenience and functionality of this website. This website may include cookies not only by us but also by third parties (advertisers, log analysts, etc.) for the purpose of tracking the activities of users. Cookie policy
