Created
: 2025.05.17


![]() 2025.05.17 02:33
2025.05.17 02:33
The Dow Jones Industrial Average (DJIA) stepped into fresh weekly highs on Friday after investors shrugged off the second-worst print from the University of Michigan's (UoM) Consumer Sentiment Index on record. Market sentiment remains on the high side as traders hope for further clarity on trade from the Trump administration and a continued easing of President Donald Trump's tariff policies.
The UoM's Consumer Sentiment Index sank to 50.8 from 52.2 as consumers' outlook for economic activity, income, and employment continues to decline. Investors were hoping for an uptick in consumer sentiment, but the average consumer apparently disagrees with Wall Street. Consumer 1-year and 5-year inflation expectations also rose, climbing to 7.3% and 4.6% respectively.
While consumers tend to be terrible at forecasting their economic futures, tariff concerns have been playing havoc on consumers' feelings about the economy. With inflation expectations continuing to climb, it could pave the way for "profit-led inflation", or businesses taking the opportunity to raise prices in the face of consumers expecting rising prices. US inflation data came in far better than expected this week, helping to assuage market fears that lopsided US trade policies could shatter the US economy's still-strong position. However, investors habitually understate the amount of time it takes for government policies to show up in headline data, and tariffs are likely no exception.
According to estimates from the Fitch Ratings agency, the US's headline Effective Tariff Rate has reached 13% following the Trump administration's fun new toy of using tariffs to try and control global trade. Prior to widespread tariffs, the US's ETR was 2.5%. The US's ETR specifically on China remains above 30% even after the walkback of President Trump's unhinged 145% import taxes.
The Trump administration has developed a pattern of threatening deeply damaging policy changes before walking them back, temporarily suspending them, or outright canceling them at the eleventh hour. Market perception broadly anticipates a continued clawback of Donald Trump's policy strategies; however, bullish animal spirits are likely to remain tepid until the Trump administration delivers some solid results and provides some clarity from the many trade agreements that White House staff have been insisting are due to be announced any day now for the last two months.
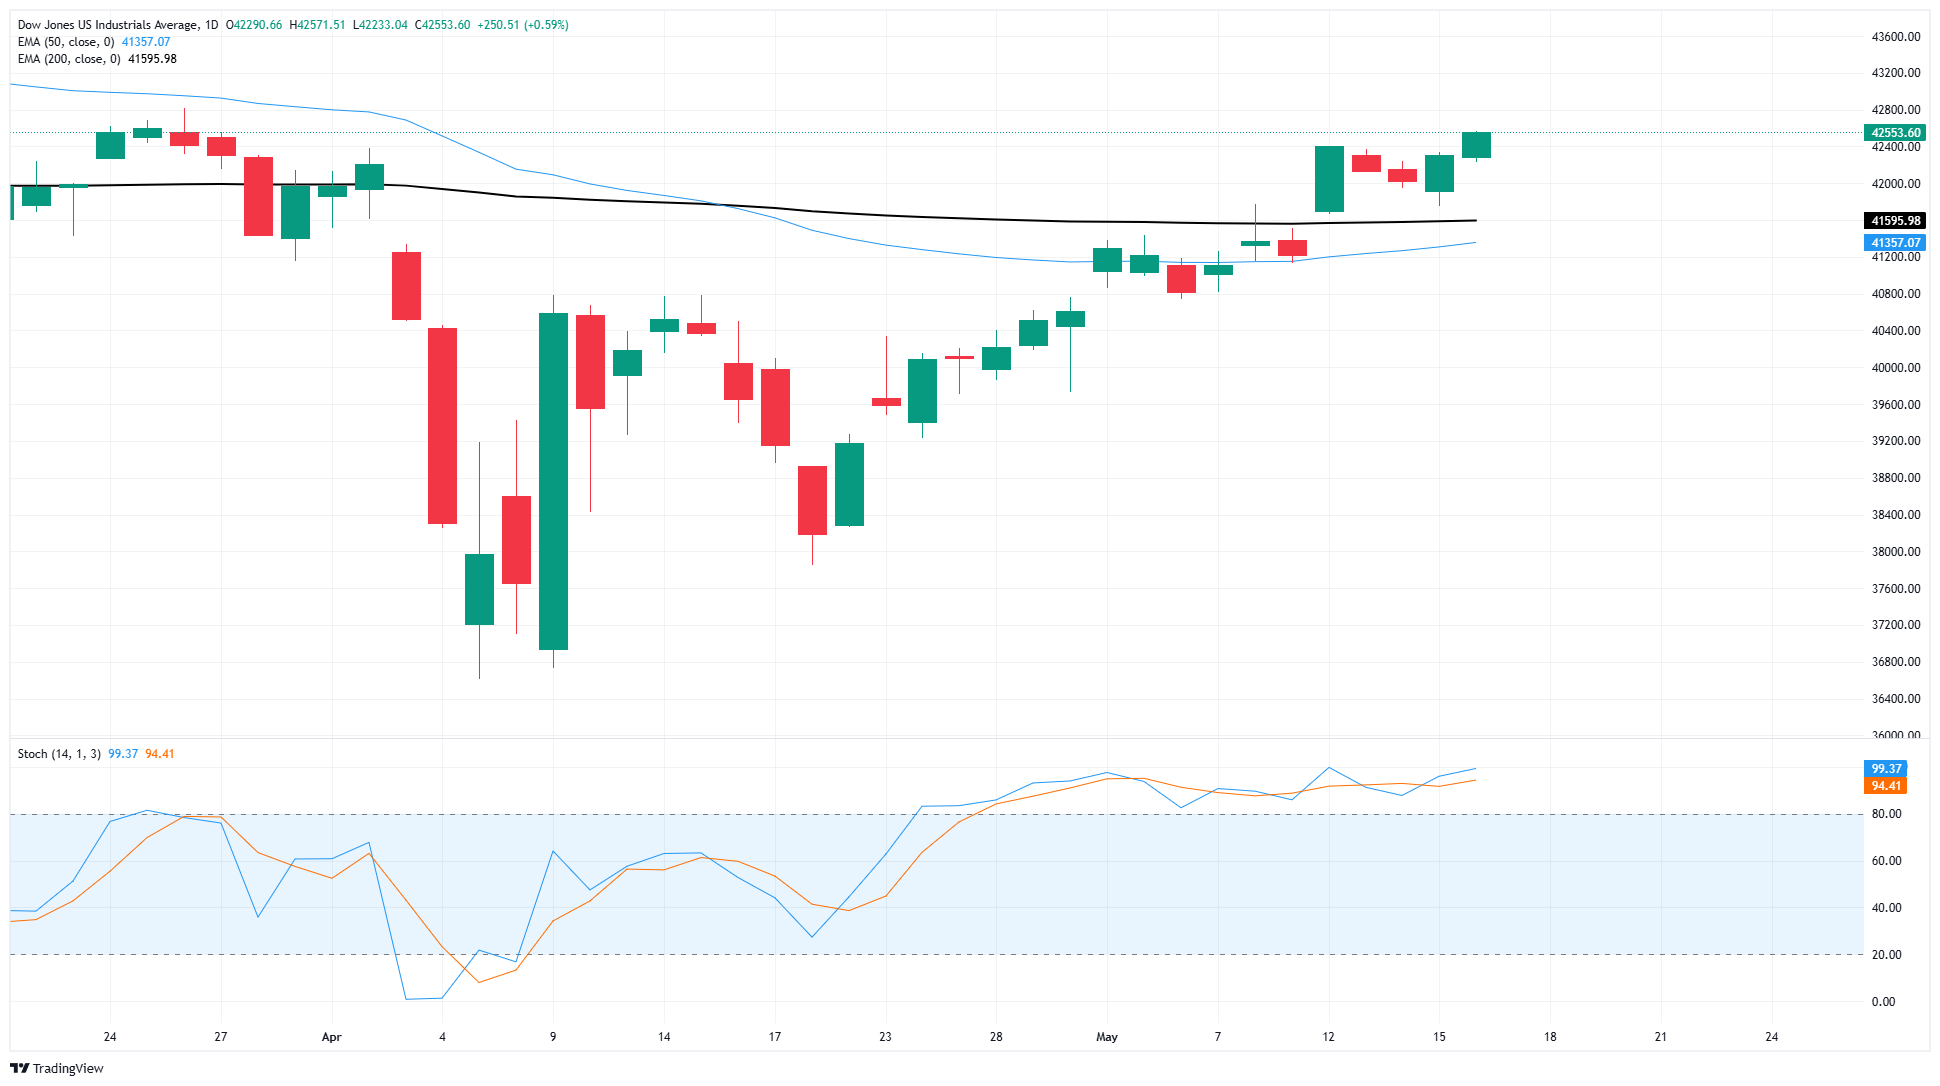
The Dow Jones Industrial Average has finally clawed its way back the 42,500 level for the first time since March. Trade headlines sent US equity markets into a freefall in the first quarter, sending the Dow Jones into the 36,600 region. After weeks of paring back losses, the DJIA is finally back into positive territory for 2025.
Bullish momentum has bolstered the Dow Jones back above the 200-day Exponential Moving Average (EMA) near 41,500, and the DJIA has rebounded 16.25% bottom-to-top. Price action is heading for a technical resistance zone priced in from March's swing high into 42,800, while the 42,000 handle is set to begin providing a technical floor.
The Dow Jones Industrial Average, one of the oldest stock market indices in the world, is compiled of the 30 most traded stocks in the US. The index is price-weighted rather than weighted by capitalization. It is calculated by summing the prices of the constituent stocks and dividing them by a factor, currently 0.152. The index was founded by Charles Dow, who also founded the Wall Street Journal. In later years it has been criticized for not being broadly representative enough because it only tracks 30 conglomerates, unlike broader indices such as the S&P 500.
Many different factors drive the Dow Jones Industrial Average (DJIA). The aggregate performance of the component companies revealed in quarterly company earnings reports is the main one. US and global macroeconomic data also contributes as it impacts on investor sentiment. The level of interest rates, set by the Federal Reserve (Fed), also influences the DJIA as it affects the cost of credit, on which many corporations are heavily reliant. Therefore, inflation can be a major driver as well as other metrics which impact the Fed decisions.
Dow Theory is a method for identifying the primary trend of the stock market developed by Charles Dow. A key step is to compare the direction of the Dow Jones Industrial Average (DJIA) and the Dow Jones Transportation Average (DJTA) and only follow trends where both are moving in the same direction. Volume is a confirmatory criteria. The theory uses elements of peak and trough analysis. Dow's theory posits three trend phases: accumulation, when smart money starts buying or selling; public participation, when the wider public joins in; and distribution, when the smart money exits.
There are a number of ways to trade the DJIA. One is to use ETFs which allow investors to trade the DJIA as a single security, rather than having to buy shares in all 30 constituent companies. A leading example is the SPDR Dow Jones Industrial Average ETF (DIA). DJIA futures contracts enable traders to speculate on the future value of the index and Options provide the right, but not the obligation, to buy or sell the index at a predetermined price in the future. Mutual funds enable investors to buy a share of a diversified portfolio of DJIA stocks thus providing exposure to the overall index.
![]()
Created
: 2025.05.17
![]()
Last updated
: 2025.05.17

FXStreet is a forex information website, delivering market analysis and news articles 24/7.
It features a number of articles contributed by well-known analysts, in addition to the ones by its editorial team.
Founded in 2000 by Francesc Riverola, a Spanish economist, it has grown to become a world-renowned information website.
We hope you find this article useful. Any comments or suggestions will be greatly appreciated.
We are also looking for writers with extensive experience in forex and crypto to join us.
please contact us at [email protected].
Disclaimer:![]()
All information and content provided on this website is provided for informational purposes only and is not intended to solicit any investment. Although all efforts are made in order to ensure that the information is correct, no guarantee is provided for the accuracy of any content on this website. Any decision made shall be the responsibility of the investor and Myforex does not take any responsibility whatsoever regarding the use of any information provided herein.
The content provided on this website belongs to Myforex and, where stated, the relevant licensors. All rights are reserved by Myforex and the relevant licensors, and no content of this website, whether in full or in part, shall be copied or displayed elsewhere without the explicit written permission of the relevant copyright holder. If you wish to use any part of the content provided on this website, please ensure that you contact Myforex.
Myforex uses cookies to improve the convenience and functionality of this website. This website may include cookies not only by us but also by third parties (advertisers, log analysts, etc.) for the purpose of tracking the activities of users. Cookie policy
