Created
: 2025.05.14


![]() 2025.05.14 02:43
2025.05.14 02:43
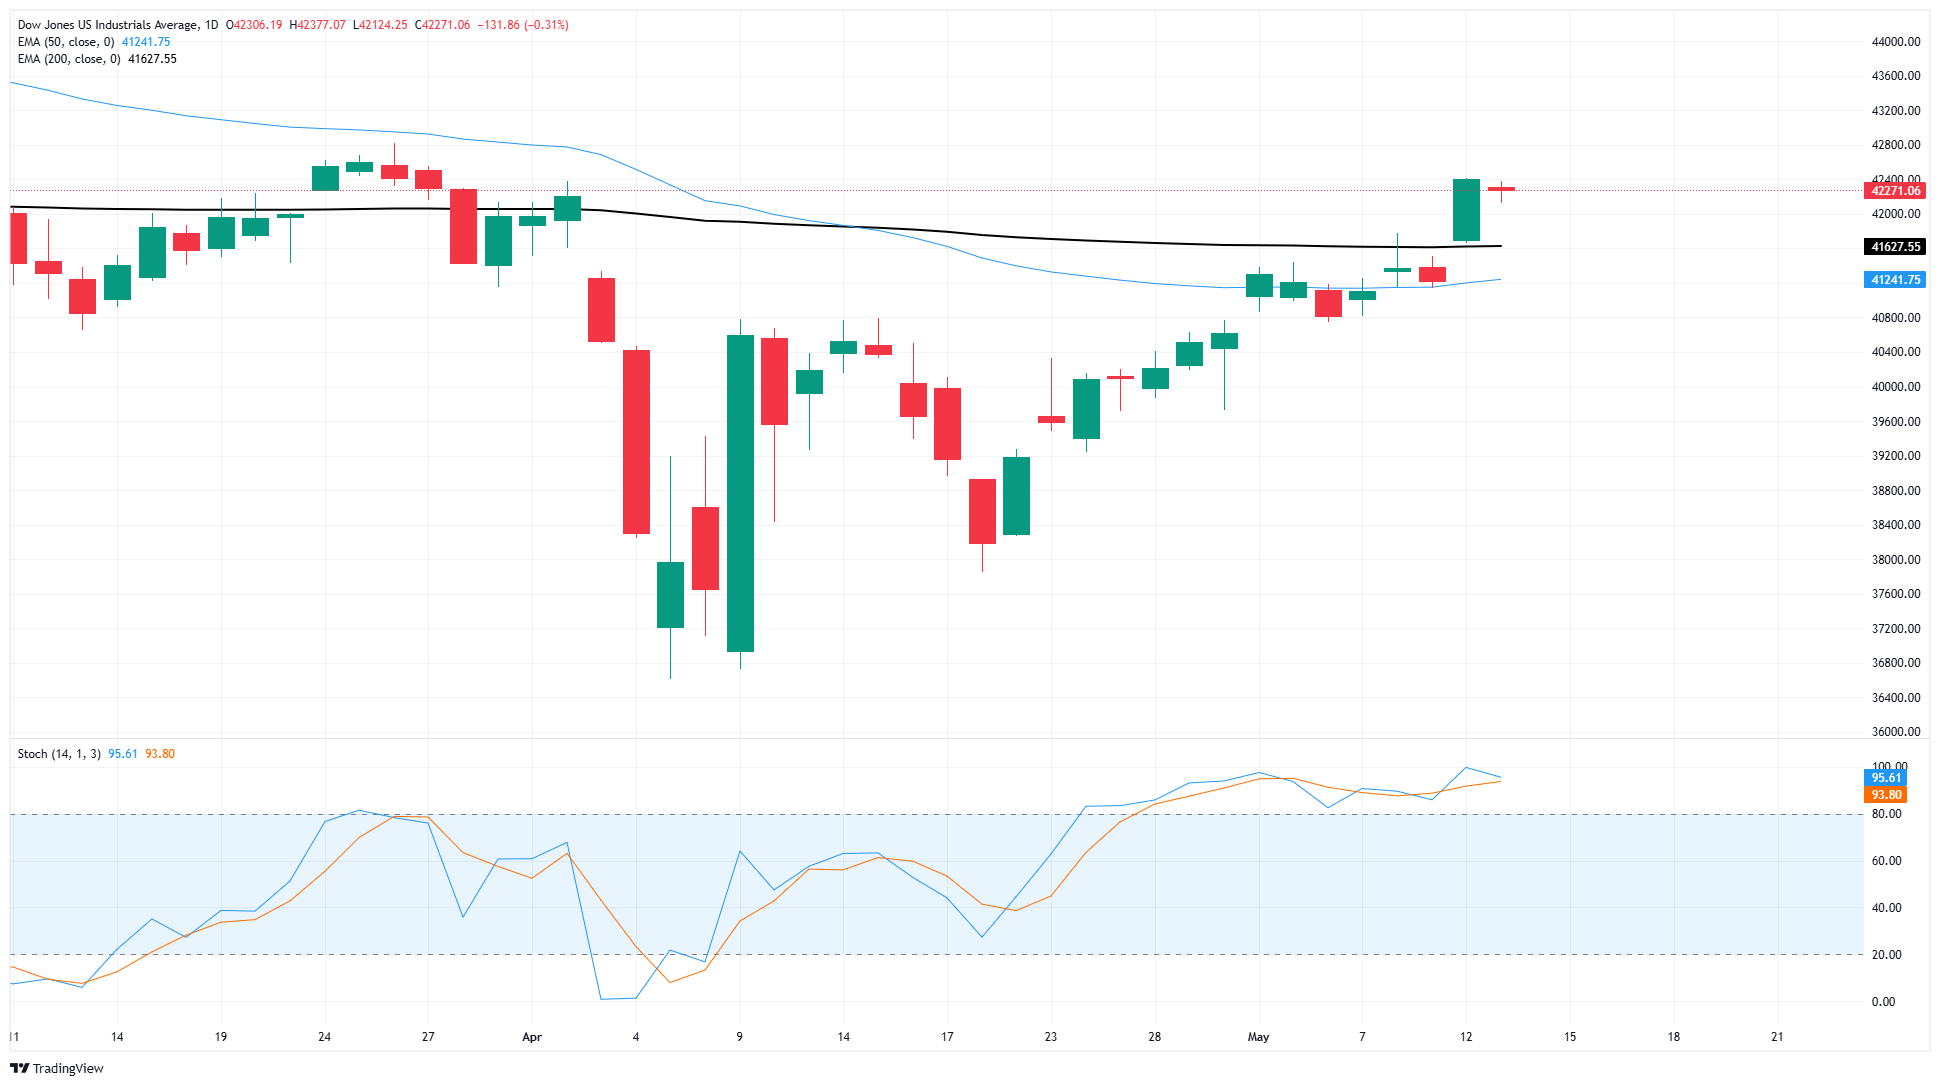
The Dow Jones Industrial Average (DJIA) trimmed momentum on Tuesday, holding close to flat and getting hung up on the 42,300 region. Steadying bids come off the heels of a stellar start to the trading week that saw the DJIA climb over a thousand points on Monday, but a firm bullish extension in tech stocks that bolstered other equity indexes higher saw the Dow Jones left in the dust on Tuesday.
United States (US) Consumer Price Index (CPI) inflation overall eased in April, with headline CPI inflation rising 0.2% MoM versus the expected 0.3% increase from March's -0.1% print. Annualized CPI also came in below expectations, rising 2.3% YoY versus the expected hold of 2.4%. Despite the lowest pace of annualized CPI inflation growth in three years, economists and markets are now bracing for tariff impacts to begin wiping out progress on walking back inflation beginning in May. According to reporting by CNBC, the chief of economist from the Moody's Ratings agency summarized April's report by saying:
"It felt like we could just about declare victory on putting inflation back in the bottle, and it's back out again. Soak this report in, it'll be a while before we get another good one."
Despite a general easing in key weighted components, such as gasoline, apparel, used cars, and airplane tickets, annualized costs of often-purchased goods continue to soar well above recorded prices a year ago. Egg prices, always a hot topic around the inflation water cooler, remain nearly 50% higher than they were at the same time last year. Many key core consumer goods also chalked in around 10% YoY price increases, including coffee (instant, roasted, and raw), ground beef and beef roasts, gas utility prices, college textbooks, admission to sporting events, and video rentals, including subscription services. Over a similar period, average US wages have risen around a dollar an hour, or a 4% increase.
US Producer Price Index (PPI) inflation figures on Thursday will follow up this week's CPI inflation print, alongside US Retail Sales data from April. The forward-looking University of Michigan Consumer Sentiment Index for May will also be released on Friday, and give investors a peek under the hood of how US consumers feel about the state of the economy. Median market forecasts are expecting a much-needed uptick in the advance sentiment indicator.
Read more stock news: UnitedHealth stock craters as CEO resigns
The Dow Jones has halted its early-week surge, pumping the brakes and pausing near 42,300. The major equity index is up over 1.5% on the week, and has reclaimed about 15.5% from early April's plunge into the 36,600 region. A fresh break to the north side of the 200-day Exponential Moving Average (EMA) near 41,500 has put the Dow Jones back on the bullish side, and bidders will be looking to extend momentum to push price action back toward record highs above 45,000.
The Dow Jones Industrial Average, one of the oldest stock market indices in the world, is compiled of the 30 most traded stocks in the US. The index is price-weighted rather than weighted by capitalization. It is calculated by summing the prices of the constituent stocks and dividing them by a factor, currently 0.152. The index was founded by Charles Dow, who also founded the Wall Street Journal. In later years it has been criticized for not being broadly representative enough because it only tracks 30 conglomerates, unlike broader indices such as the S&P 500.
Many different factors drive the Dow Jones Industrial Average (DJIA). The aggregate performance of the component companies revealed in quarterly company earnings reports is the main one. US and global macroeconomic data also contributes as it impacts on investor sentiment. The level of interest rates, set by the Federal Reserve (Fed), also influences the DJIA as it affects the cost of credit, on which many corporations are heavily reliant. Therefore, inflation can be a major driver as well as other metrics which impact the Fed decisions.
Dow Theory is a method for identifying the primary trend of the stock market developed by Charles Dow. A key step is to compare the direction of the Dow Jones Industrial Average (DJIA) and the Dow Jones Transportation Average (DJTA) and only follow trends where both are moving in the same direction. Volume is a confirmatory criteria. The theory uses elements of peak and trough analysis. Dow's theory posits three trend phases: accumulation, when smart money starts buying or selling; public participation, when the wider public joins in; and distribution, when the smart money exits.
There are a number of ways to trade the DJIA. One is to use ETFs which allow investors to trade the DJIA as a single security, rather than having to buy shares in all 30 constituent companies. A leading example is the SPDR Dow Jones Industrial Average ETF (DIA). DJIA futures contracts enable traders to speculate on the future value of the index and Options provide the right, but not the obligation, to buy or sell the index at a predetermined price in the future. Mutual funds enable investors to buy a share of a diversified portfolio of DJIA stocks thus providing exposure to the overall index.
![]()
Created
: 2025.05.14
![]()
Last updated
: 2025.05.14

FXStreet is a forex information website, delivering market analysis and news articles 24/7.
It features a number of articles contributed by well-known analysts, in addition to the ones by its editorial team.
Founded in 2000 by Francesc Riverola, a Spanish economist, it has grown to become a world-renowned information website.
We hope you find this article useful. Any comments or suggestions will be greatly appreciated.
We are also looking for writers with extensive experience in forex and crypto to join us.
please contact us at [email protected].
Disclaimer:![]()
All information and content provided on this website is provided for informational purposes only and is not intended to solicit any investment. Although all efforts are made in order to ensure that the information is correct, no guarantee is provided for the accuracy of any content on this website. Any decision made shall be the responsibility of the investor and Myforex does not take any responsibility whatsoever regarding the use of any information provided herein.
The content provided on this website belongs to Myforex and, where stated, the relevant licensors. All rights are reserved by Myforex and the relevant licensors, and no content of this website, whether in full or in part, shall be copied or displayed elsewhere without the explicit written permission of the relevant copyright holder. If you wish to use any part of the content provided on this website, please ensure that you contact Myforex.
Myforex uses cookies to improve the convenience and functionality of this website. This website may include cookies not only by us but also by third parties (advertisers, log analysts, etc.) for the purpose of tracking the activities of users. Cookie policy
