
- English
- English
- What's Myforex
- Share
- Use tools
- Get information
- What's New
- Help center
- About us
- Customer support
- Terms and policies


-

-
 Real-time spread comparisonCompare spreads of major retail brokers in real time
 -
 Volatility analysisVisualize volatility as a measure of daily market activity
 -
 Swap point comparisonCompare buy and sell swap values for each broker by symbol
 -
 Market rates & chartsCheck prices for all instruments offered by each broker
 -
 IndicatorsProviding in-house developed indicators for MT4/MT5
 -
 Trading calculatorsCalculation tools for each broker to help you trade


Higher timeframe indicator (trend indicators)
Higher timeframe indicator (trend indicators)
- Overview
- How to install
- How to set up
Display:


![]()
![]()
![]()
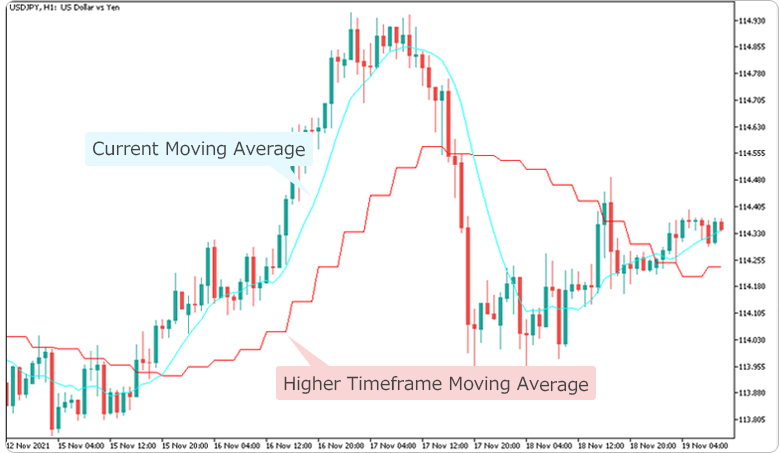
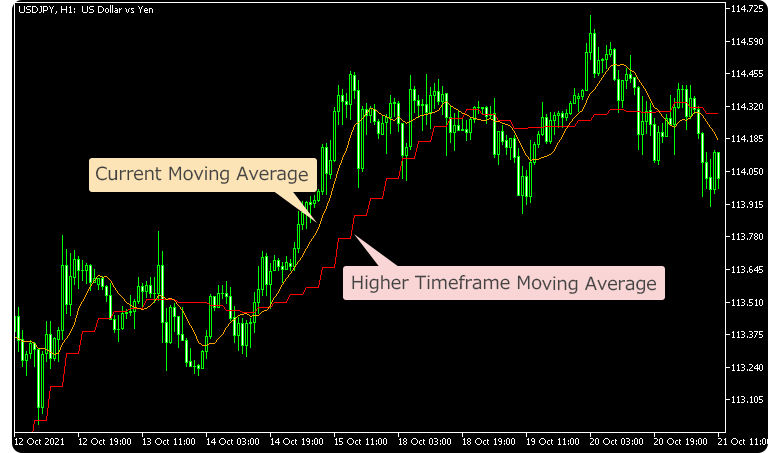
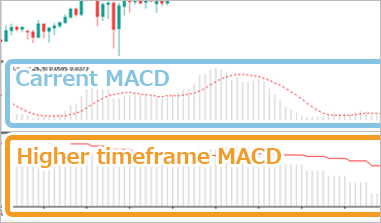
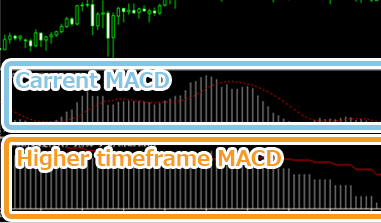
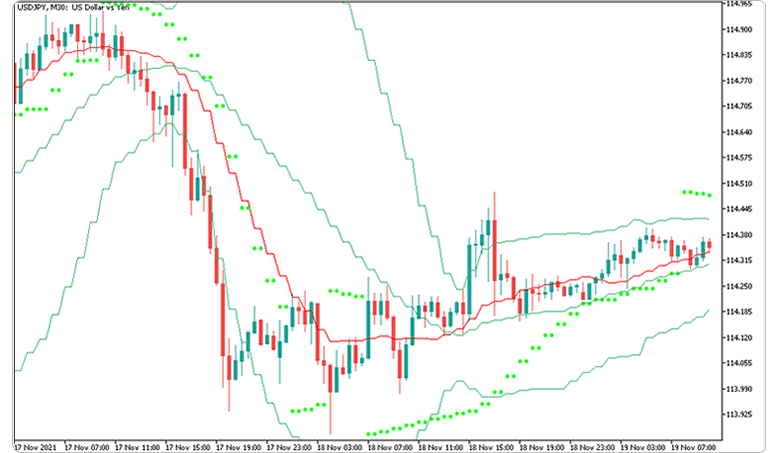
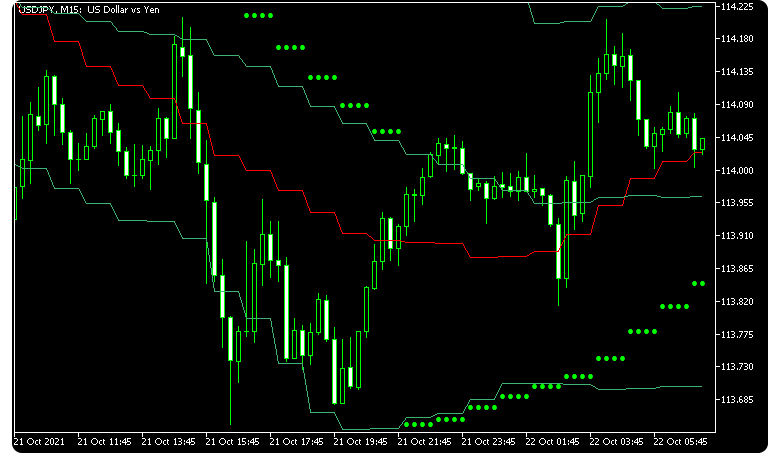
The higher timeframe indicator (trend indicators) is an indicator to display moving average, parabolic SAR, or Bollinger bands of the same or higher timeframe than the one for the current chart. It shows the technical indicators of different timeframes on a single chart, which will be useful if you want to check the long-term technical indicators to grasp the market direction before making short-term trades.
![]()
![]()
![]()
Features
Check values for different timeframes
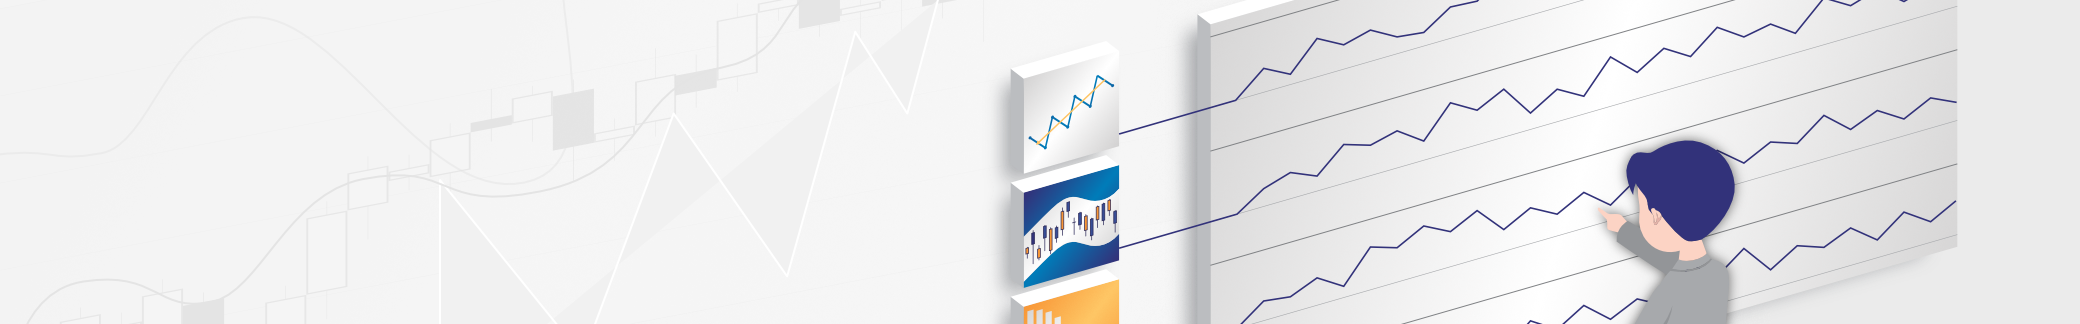
The higher timeframe indicator (trend indicators) can display the technical indicators with different timeframes, e.g., showing the 4-hour moving average on the 1-hour chart. As 4 candles on the 1-hour chart are equivalent to 1 candle on the 4-hour chart, it will be drawn stepwise.
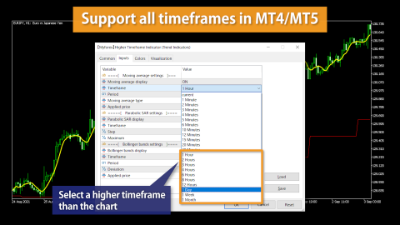
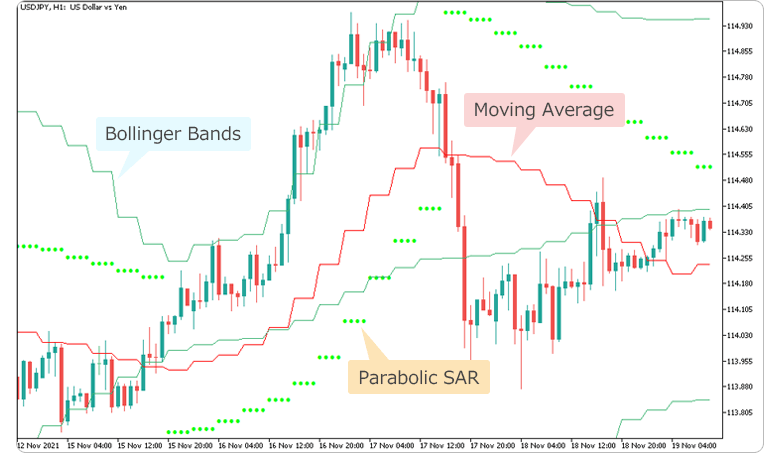
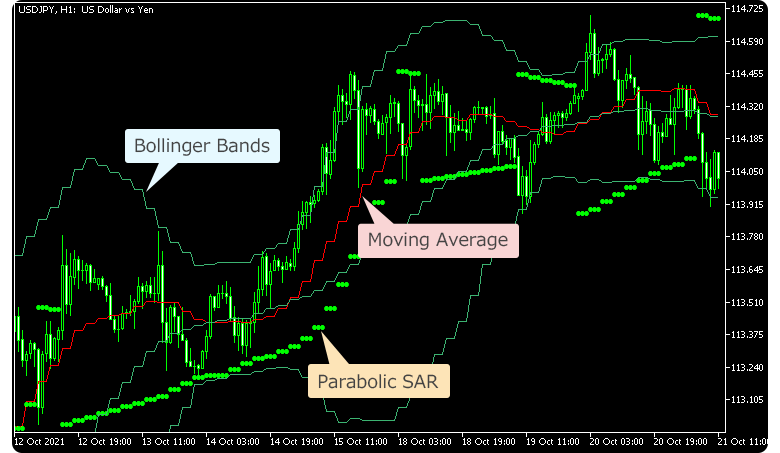
The higher timeframe indicator (trend indicators) can show three types of technical indicators:
- Moving average
- Parabolic SAR
- Bollinger bands
Each technical indicator can be turned on or off on parameters, which offers a great degree of customizability, such as displaying a single indicator, or a certain combination.
Note that although it is possible to display, for example, both of the 4-hour and daily higher timeframe indicators on a 1-hour chart, if this indicator is applied to the chart several times, it may take time to appear on the chart. In this case, please wait for a while or press the "Refresh" button on the chart.
The higher timeframe indicator (trend indicators) will only be displayed if you choose the same or a higher timeframe than the chart you are viewing. If you select a timeframe lower than the current one, the indicator will not be displayed. If you select the same timeframe as the chart you are viewing, the usual moving average, parabolic SAR, or Bollinger bands will be displayed.
Parameters of each technical indicator can be customized
Each technical indicator has its own parameter settings that can be changed. The customizable items are the same as for regular MetaTrader4/MetaTrader5.
Take moving average, for example, you can set the "Period", "Moving average type" and "Applied price", so that you can display a technical indicator that suits your strategy.
The value of the "Period" indicates how many candles are to be included in the calculation of technical indicators. For example, if "20" is set for a 1-hour chart, the technical indicator will be calculated based on "1 hour x 20 candles", or 20 hours of price movements. As for "Applied price", it indicates which price is used to calculate the technical indicator, and "Close price" is commonly used.
Also, we offer the higher timeframe indicator (oscillators) with similar features, which can display three types of technical indicators: MACD, RSI, and Stochastics.
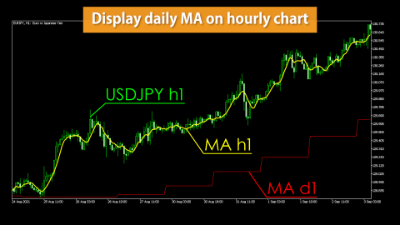
Supports all MT4/MT5 timeframes
The higher timeframe indicator (trend indicators) can display every timeframe supported by MetaTrader4/MetaTrader5.
| MetaTrader4 | MetaTrader5 | |
| Minutes | M1, M5, M15, M30 | M1, M2, M3, M4, M5, M6, M10, M12, M15, M20, M30 |
| Hours | H1, H4 | H1, H2, H3, H4, H6, H8, H12 |
| Others | Daily, Weekly, Monthly | Daily, Weekly, Monthly |
| MetaTrader4 | |
|---|---|
| Minutes | M1, M5, M15, M30 |
| Hours | H1, H4 |
| Others | Daily, Weekly, Monthly |
| MetaTrader5 | |
| Minutes | M1, M2, M3, M4, M5, M6, M10, M12, M15, M20, M30 |
| Hours | H1, H2, H3, H4, H6, H8, H12 |
| Others | Daily, Weekly, Monthly |
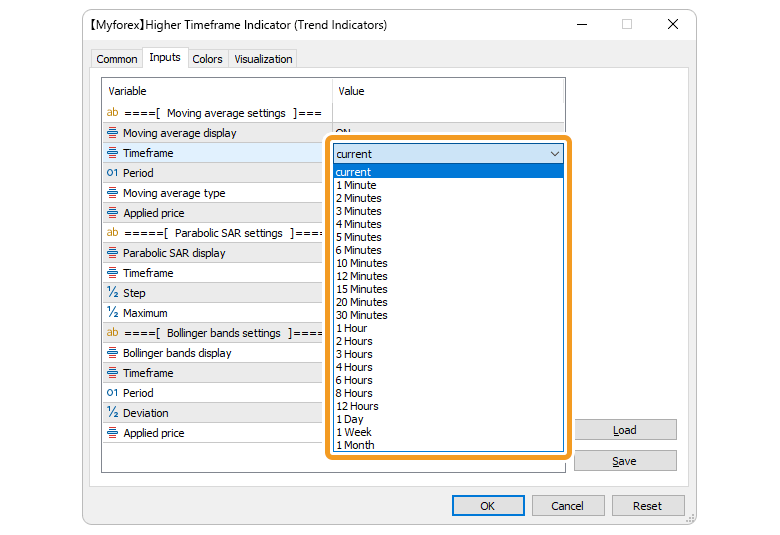
You can set the timeframe on the "Timeframe" parameter of each technical indicator. By selecting "current", the chart's timeframe will be applied, while you can also select a specific timeframe to apply.
How to install
To use the higher timeframe indicator (trend indicators), install the "【Myforex】Higher Timeframe Indicator (Trend Indicators)" file on MetaTrader4/MetaTrader5.
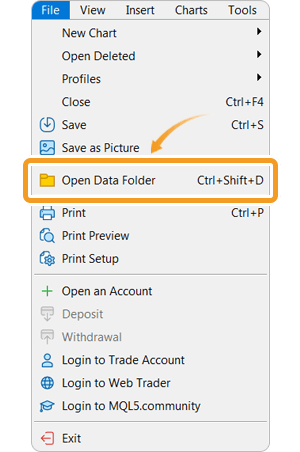
Step 1
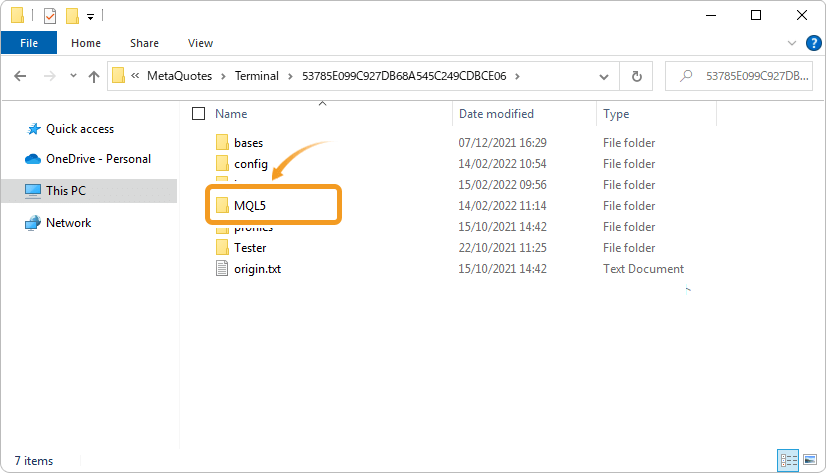
Click "File" from the menu bar at the top of MetaTrader4/MetaTrader5 and choose "Open Data Folder".
Step 2
After opening the data folder, double-click the folder "MQL5 (MQL4 for MetaTrader4)" in it to open it.
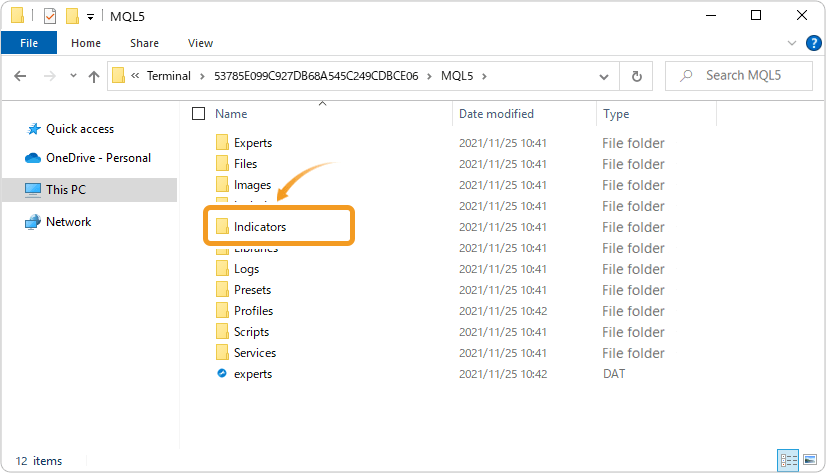
Step 3
Double-click to open "Indicators" folder in the MQL5 file.
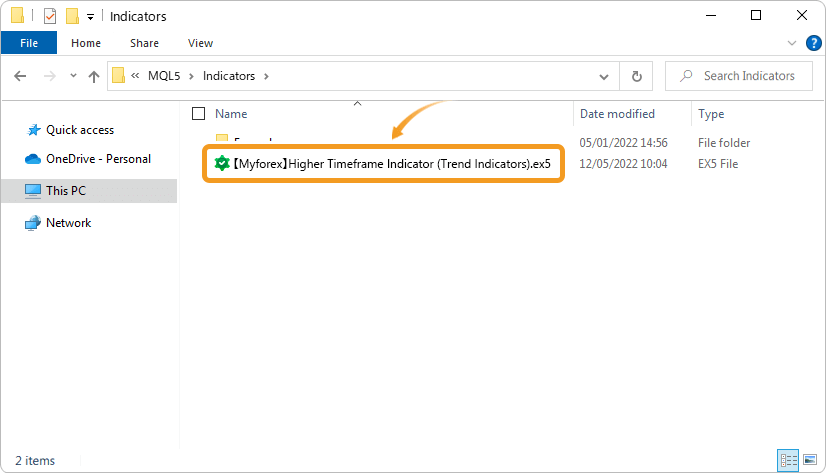
Step 4
Save the "【Myforex】Higher Timeframe Indicator (Trend Indicators)" in the "Indicators" folder.
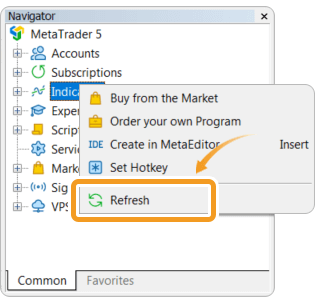
Step 5
Once the file is in the folder, right-click "Indicators" in the Navigator and choose "Refresh" from the displayed menu.
Step 6
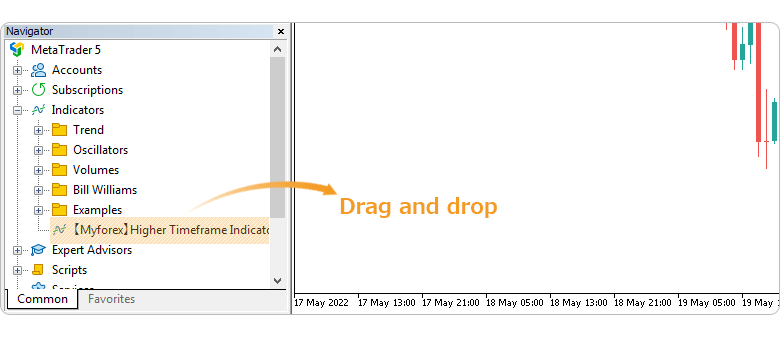
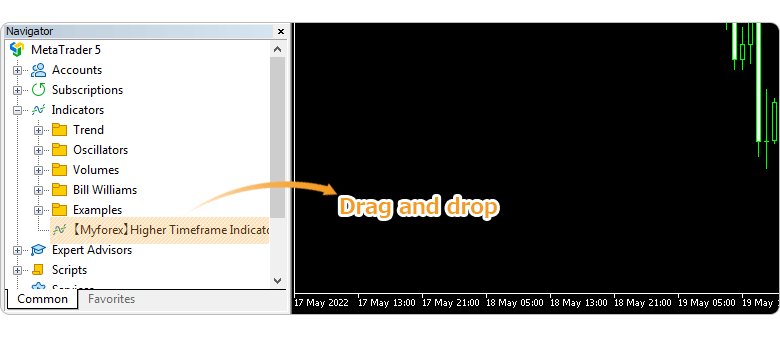
After checking that the higher timeframe indicator (trend indicators) is shown in the "Indicators" of the Navigator, apply it to a chart by double-clicking or dragging and dropping.
Step 7
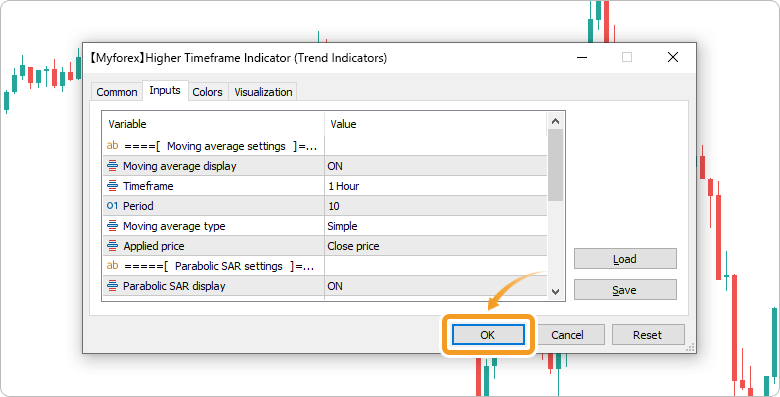
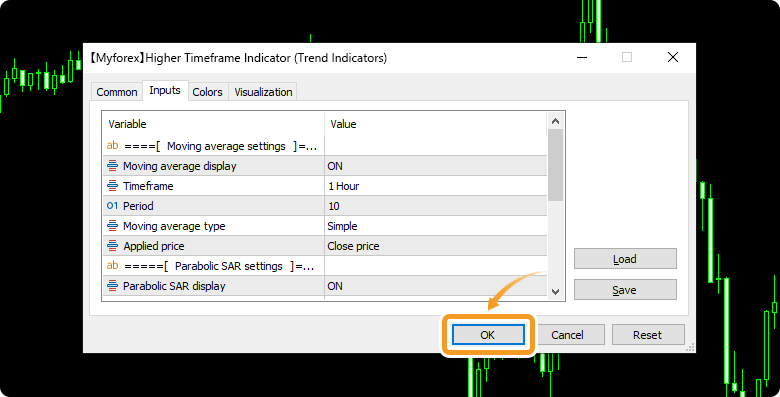
Refer to the "How to set up" page to make further settings in the "Inputs" tab, then click "OK".
Step 8
The higher timeframe indicator (trend indicators) is applied to the chart and the technical indicators of higher timeframe will be displayed.
How to set up
After applying the indicator to the chart, set the parameters according to your style.
Step 1
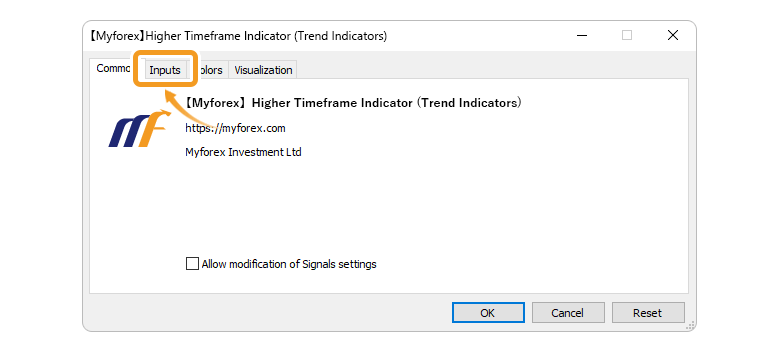
First, open the "Inputs" tab.
Step 2
Set the parameters as follows.
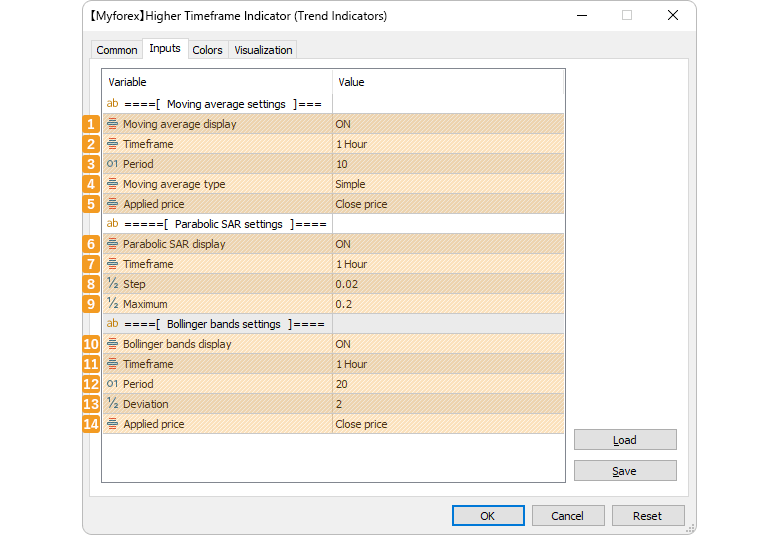
Moving average settings
Number |
Item name |
Description |
|---|---|---|
1 |
Moving average |
Select ON or OFF to display or hide moving average. |
2 |
Timeframe |
Select the timeframe for the moving average to be displayed. If you select "current," it will be the same as the current chart. |
3 |
Period |
Set the calculation period for the moving average. |
4 |
Moving average type |
Select the type of moving average to display. ・Simple :simple moving average |
5 |
Applied price |
Select the price to use for moving average calculation. ・Close price |
Parabolic SAR settings
Number |
Item name |
Description |
|---|---|---|
6 |
Parabolic SAR display |
Select ON or OFF to display or hide parabolic SAR. |
7 |
Timeframe |
Select the timeframe for the parabolic SAR to be displayed. If you select "current," it will be the same as the current chart. |
8 |
Step |
Enter the step for the parabolic SAR. |
9 |
Maximum |
Set the maximum acceleration factor for the parabolic SAR. |
Bollinger bands settings
Number |
Item name |
Description |
|---|---|---|
10 |
Bollinger bands display |
Select ON or OFF to display or hide Bollinger bands. |
11 |
Timeframe |
Select the timeframe for the Bollinger bands to be displayed. If you select "current," it will be the same as the current chart. |
12 |
Period |
Set the calculation period for the Bollinger bands. |
13 |
Deviation |
Set the deviation for the Bollinger bands. Related article: Add Bollinger Bands to chart |
14 |
Applied price |
Select the price to use for Bollinger bands calculation. ・Close price |
![]()
Created
: 2022.05.26
![]()
Last updated
: 2026.03.11
Disclaimer:![]()
All information and content provided on this website is provided for informational purposes only and is not intended to solicit any investment. Although all efforts are made in order to ensure that the information is correct, no guarantee is provided for the accuracy of any content on this website. Any decision made shall be the responsibility of the investor and Myforex does not take any responsibility whatsoever regarding the use of any information provided herein.
The copyright in our content belongs to us.
We welcome your use of our content within appropriate limits, including use through our sharing features, sharing on social media, and quotation. However, please refrain from unauthorized reuse, including but not limited to commercial use, reproduction with modification of content, or reproduction on websites that compete with us. We may take necessary measures, including but not limited to deletion of the relevant content, if we consider that the content has been used in an inappropriate or unauthorized manner.
Myforex uses cookies to improve the convenience and functionality of this website. This website may include cookies not only by us but also by third parties (advertisers, log analysts, etc.) for the purpose of tracking the activities of users. Cookie policy
