


Created
: 2022.07.27


On MetaTrader4 (MT4) / MetaTrader5 (MT5), you can display the Bollinger Bands, which consists of a set of trendlines plotted based on the standard deviations above and below a moving average of the price. The Bollinger Bands let you see the volatility at a glance and give you an idea of how much the price is dispersed from the average.
Here we will look at how to add the Bollinger Bands to a chart on MT4/MT5.
Switch between MT4/MT5 tabs to check the steps for each.
The Bollinger Bands can be set up from the menu or Navigator.
The middle line of the Bollinger Bands is a simple moving average (SMA). Changing it to an exponential moving average (EMA) or other MAs, or hiding it is not allowed in MT4/MT5.
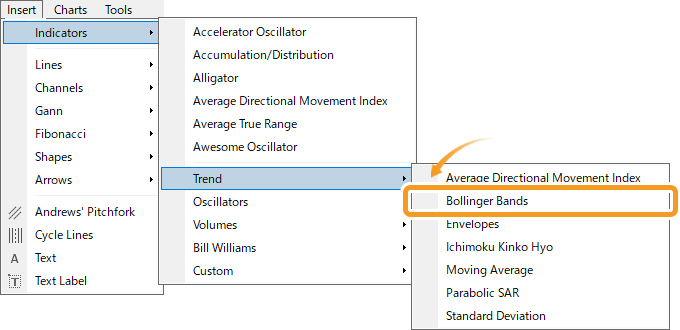
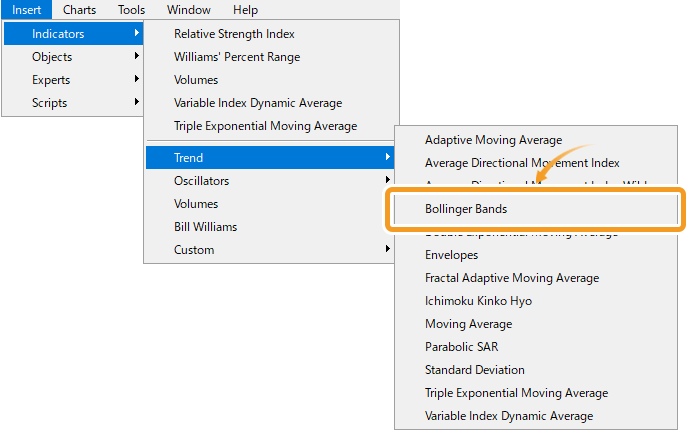
Click "Insert" in the menu. Hover the pointer over "Indicators" > "Trend" and select "Bollinger Bands".
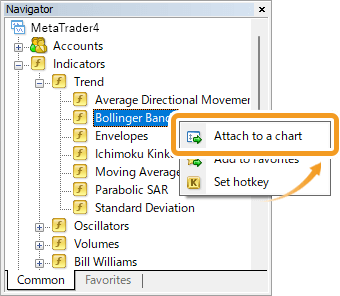
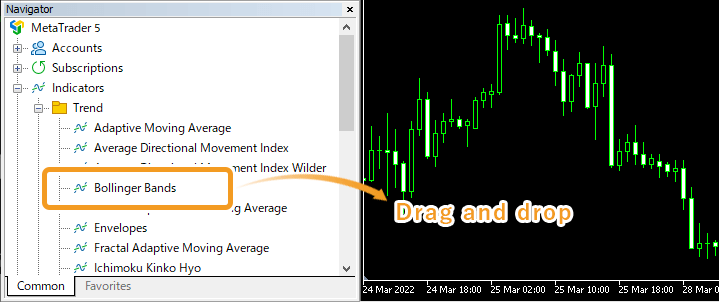
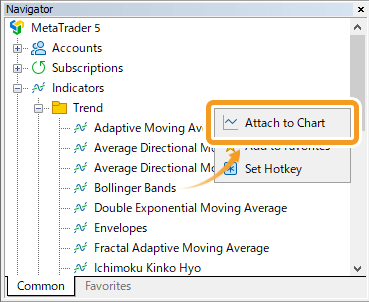
On the Navigator, click on the "+" signs next to "Indicators" and "Trend". Select "Bollinger Bands" and drag it onto the chart you wish to apply it to.
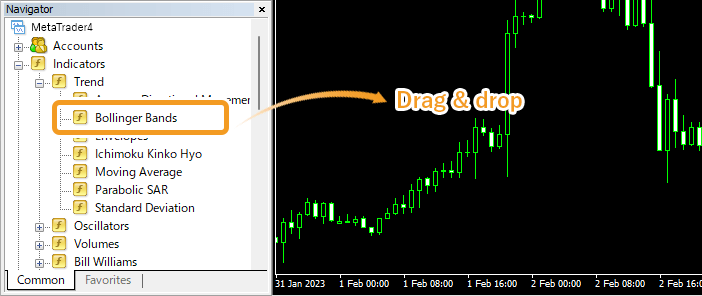
Or, right-click on "Bollinger Bands" and select "Attach to a chart".
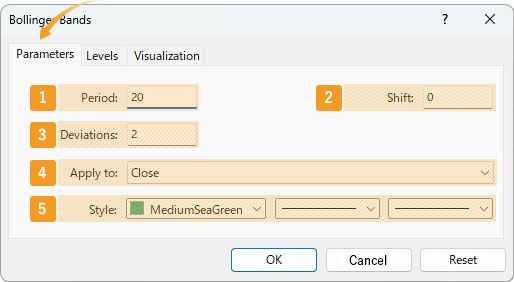
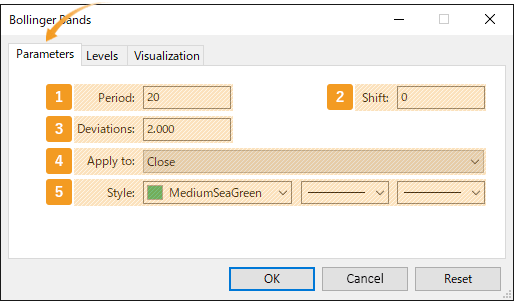
The setting window for Bollinger Bands will appear. Set the parameters in the "Parameters", "Levels", and "Visualization" tabs and click "OK".
|
Number |
Item name |
Descriptions |
|---|---|---|
|
1 |
Period |
Set the period for the moving average. The unit here is the number of candlesticks. If you select the daily chart and set it to "20", the Bollinger Bands for the past 20 days will be generated. |
|
2 |
Shift |
You can shift the placement of the Bollinger Bands to the left or right. The unit is the number of candles. Type a positive value to move it to the right, and a negative value to move it to the left. |
|
3 |
Deviations |
Set the standard deviation. If you set it to "2", Bollinger Bands will be formed with ±2σ deviation. |
|
4 |
Apply to |
Price to use for calculating Bollinger Bands. Close: close price Open: open price High: high price Low: low price Median Price (HL/2): (high price + low price) ÷2 Typical Price (HLC/3): (high price + low price + close price) ÷3 Weighted Close (HLCC/4): (high price + low price + close price×2) ÷4 Previous Indicator's Data: the value of the indicator displayed last First Indicator's Data: the value of the indicator displayed first |
|
5 |
Style |
Set the color, line type, and line thickness for Bollinger bands. |
Among the options in the "Apply to" field, "Previous Indicator's Data" and "First Indicator's Data" use the values of an indicator displayed in a sub-window, rather than the price of the chart's symbol.
For example, if volume is shown as the first indicator in a sub-window and you select First Indicator's Data, the Bollinger Bands will be calculated based on the volume.
On MT4, these options remain visible even when not available, but if selected in such cases, they will automatically default to Close.
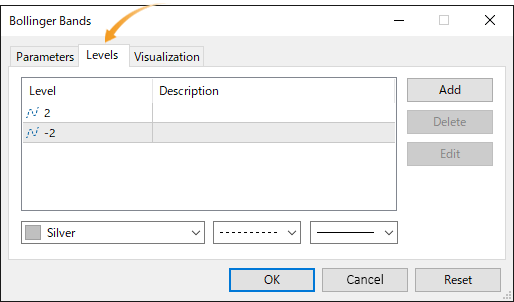
To add a band, go to the "Levels" tab and click "Add" to enter your preferred multiplier for the standard deviation of the main Bollinger Bands. For example, if "Deviations" is set at "2" and the level is also "2", a new band will be formed with "4σ".
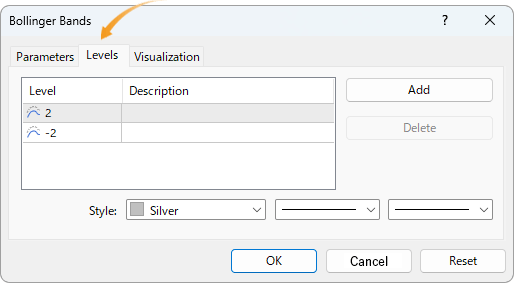
When the "Deviations" parameter in the "Parameter" tab is set to "1", and "2" and "-2" are added in the "Levels" tab, you will see two sets of bands, ±1σ and ±2σ. The "Levels" tab specifies the value that the standard deviation of the main Bollinger Bands is to be multiplied by. Therefore, setting the "Deviation" parameter at "1" can make it simple to tell what a standard deviation of an additional band will be, which is, the same as the value of the multiplier.
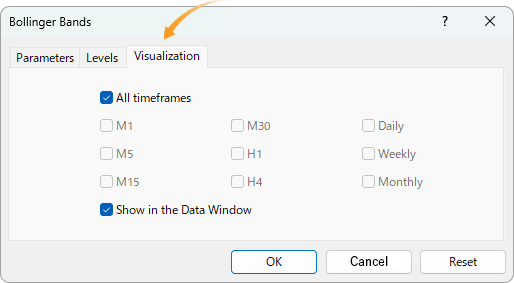
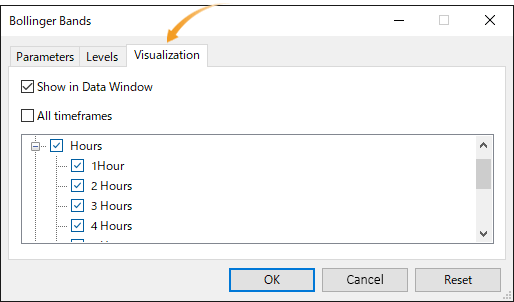
On the "Visualization" tab, you can show/hide Bollinger Bands in the Data Window and specify the timeframes to use Bollinger Bands with.
The Bollinger Bands come from the theory of standard deviation and normal distribution. Standard deviation shows how much the data (price in this case) is spread out relative to the average. The theory of normal distribution defines the probability of a data group falling within a certain range. See the figure on the right for more details.
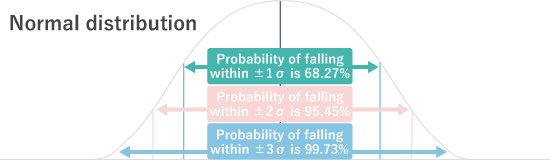
Bollinger Bands are a technical indicator that applies statistics to charts. The lines represent ±1σ, ±2σ, and ±3σ, from the center outward. However, keep in mind that markets do not always follow the rules of normal distribution.
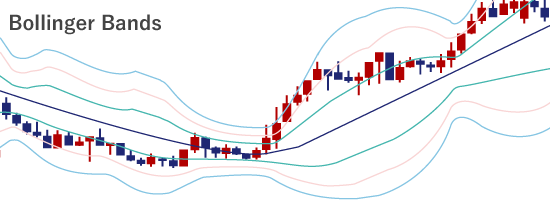
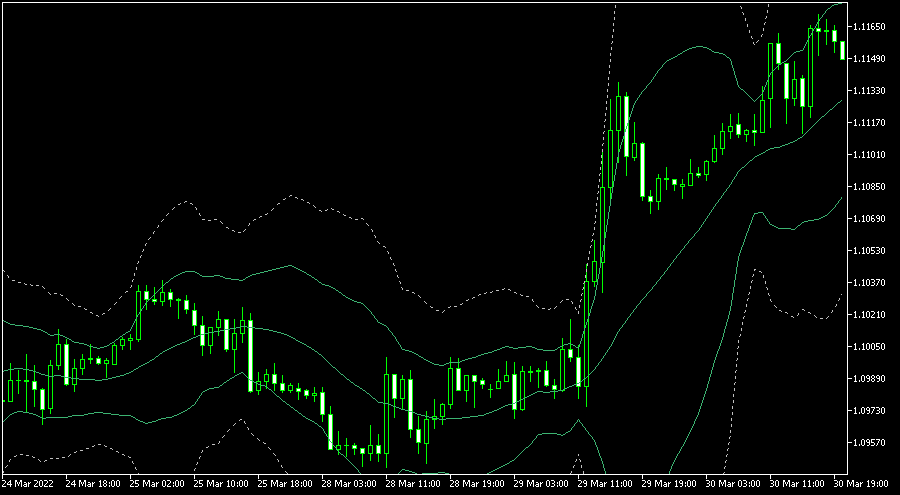
Bollinger Bands will be displayed on the chart. The upper line of the Bollinger Bands is called the upper band, the middle one is the middle line, and the lower one is the lower band.
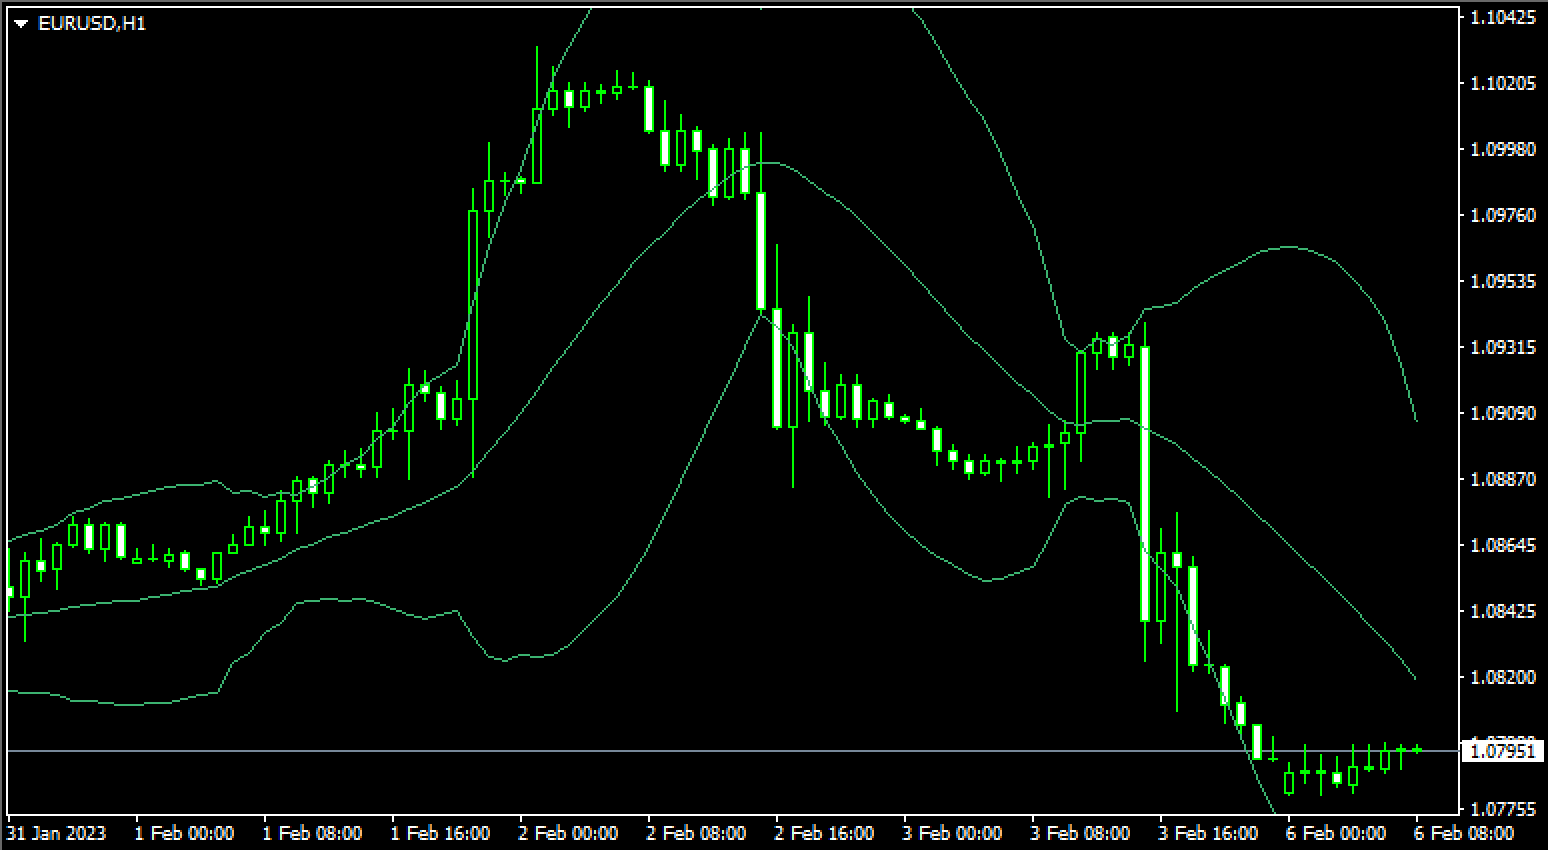
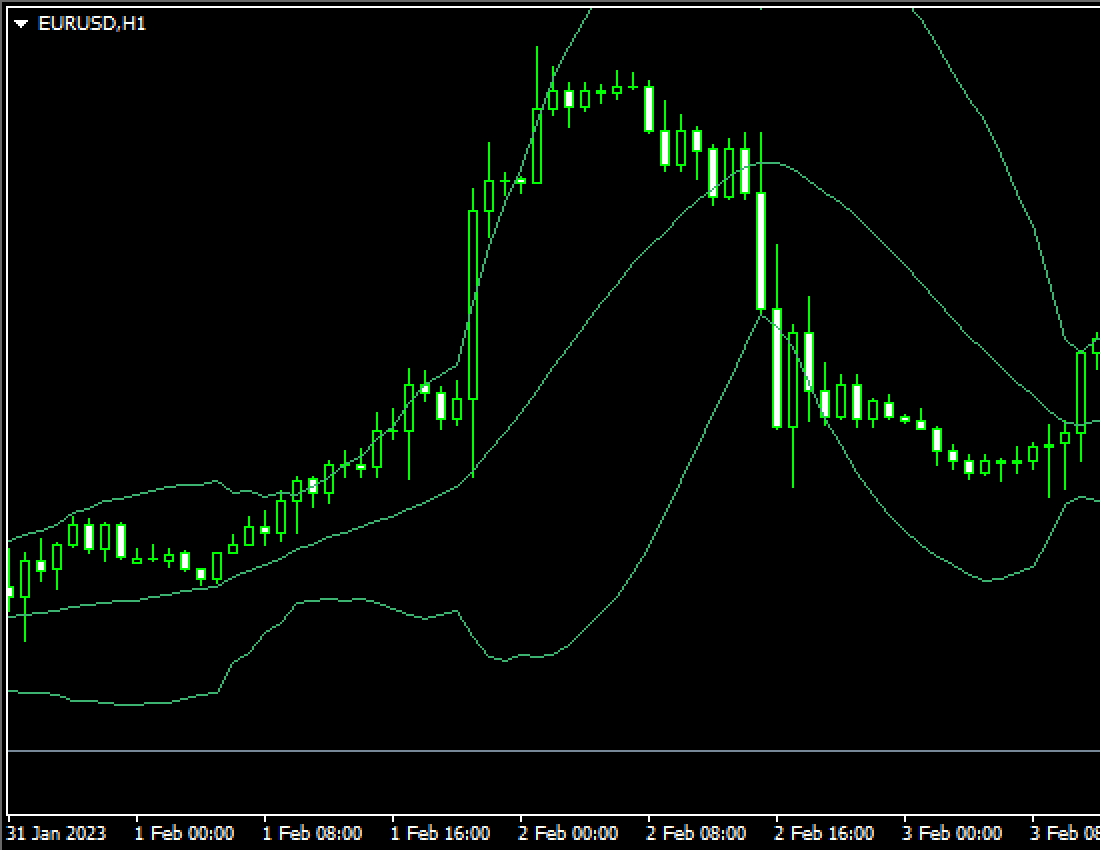
To display multiple Bollinger Bands on the chart, You can add a standard deviation from the "Levels" tab, or follow the same steps above to add another Bollinger Bands. Alternatively, go to the "Parameters" tab and adjust the moving average and standard deviation settings to display multiple Bollinger Bands on the same chart.
The Bollinger Bands can be set up from the menu or Navigator.
The middle line of the Bollinger Bands is a simple moving average (SMA). Changing it to an exponential moving average (EMA) or other MAs, or hiding it is not allowed in MT4/MT5.
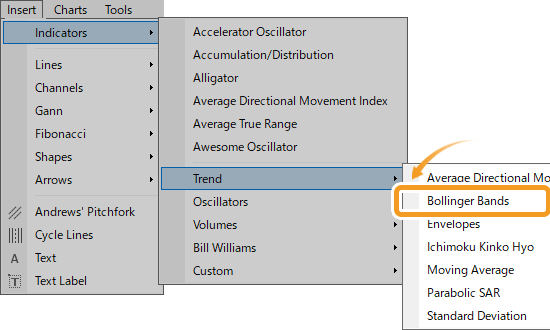
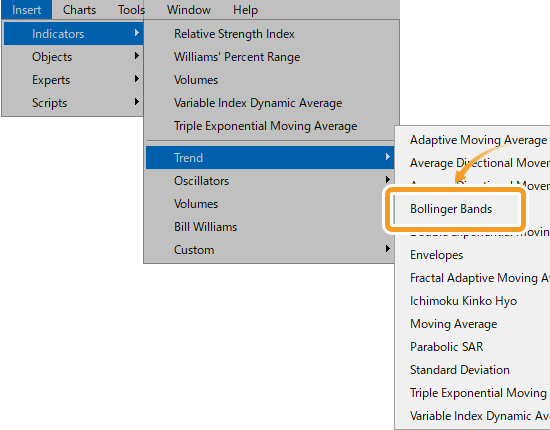
Click "Insert" in the menu. Hover the pointer over "Indicators" > "Trend" and select "Bollinger Bands".
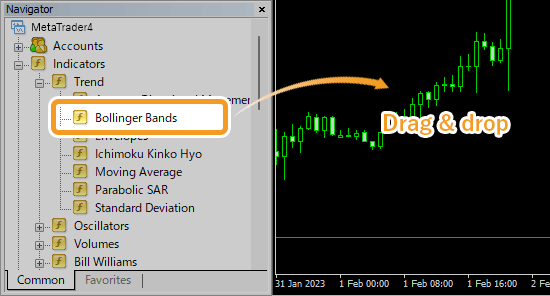
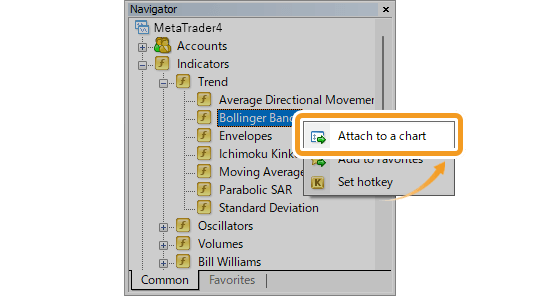
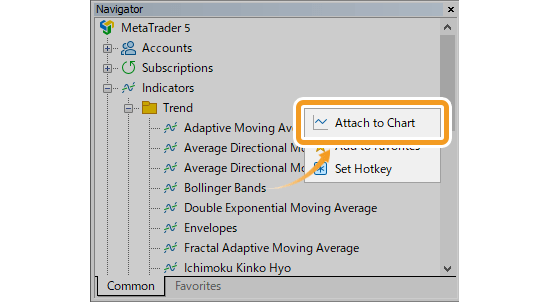
On the Navigator, go to "Indicators" and click on the "+" sign next to "Trend". Select "Bollinger Bands" and drag it onto the chart you wish to apply it to.
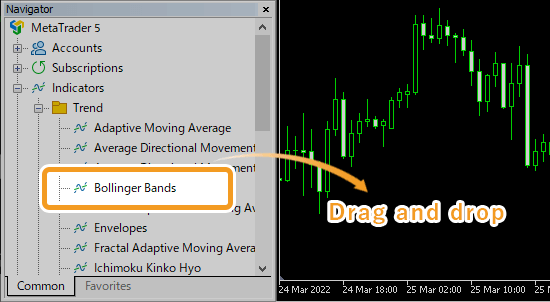
Or, right-click on "Bollinger Bands" and select "Attach to Chart".
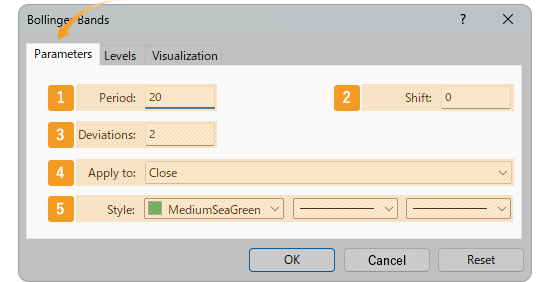
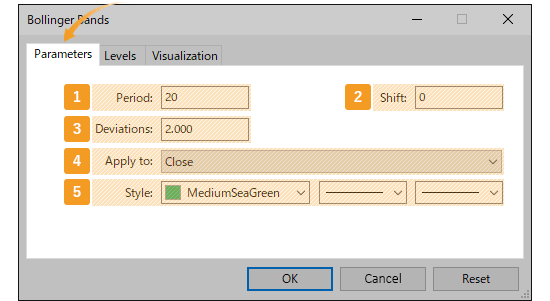
The setting window for Bollinger Bands will appear. Set the parameters in the "Parameters", "Levels", and "Visualization" tab and click "OK".
|
Number |
Item name |
Descriptions |
|---|---|---|
|
1 |
Period |
Set the period for the moving average. The unit here is the number of candlesticks. If you select the daily chart and set it to "20", the Bollinger Bands for the past 20 days will be generated. |
|
2 |
Shift |
You can shift the placement of the Bollinger Bands to the left or right. The unit is the number of candles. Type a positive value to move it to the right, and a negative value to move it to the left. |
|
3 |
Deviations |
Set the standard deviation. If you set it to "2", Bollinger Bands will be formed with ±2σ deviation. |
|
4 |
Apply to |
Price to use for calculating Bollinger Bands. Close: close price Open: open price High: high price Low: low price Median Price (HL/2): (high price + low price) ÷2 Typical Price (HLC/3): (high price + low price + close price) ÷3 Weighted Close (HLCC/4): (high price + low price + close price×2) ÷4 Previous indicator's data: the price data applied to the previous indicator First indicator's data: the price data applied to the first indicator Previous Indicator's Data: the value of the indicator displayed last First Indicator's Data: the value of the indicator displayed first |
|
5 |
Style |
Set the color, line type, and line thickness for Bollinger bands. |
Among the options in the "Apply to" field, "Previous Indicator's Data" and "First Indicator's Data" use the values of an indicator displayed in a sub-window, rather than the price of the chart's symbol.
For example, if volume is shown as the first indicator in a sub-window and you select First Indicator's Data, the Bollinger Bands will be calculated based on the volume.
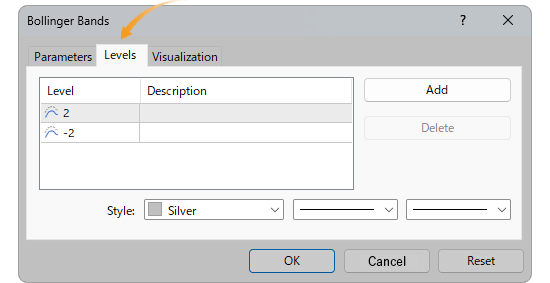
To add a band, go to the "Levels" tab and click "Add" to enter your preferred multiplier for the standard deviation of the main Bollinger Bands. For example, if "Deviations" is set at "2" and the level is also "2", a new band will be formed with "4σ".
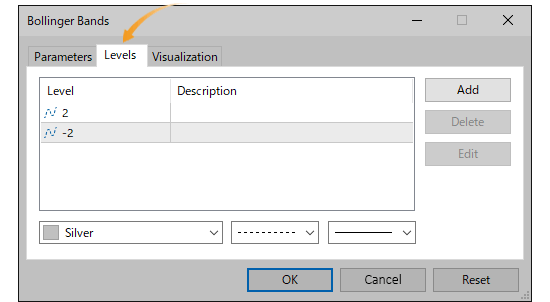
When the "Deviations" parameter in the "Parameter" tab is set to "1", and "2" and "-2" are added in the "Levels" tab, you will see two sets of bands, ±1σ and ±2σ. The "Levels" tab specifies the value that the standard deviation of the main Bollinger Bands is to be multiplied by. Therefore, setting the "Deviation" parameter at "1" can make it simple to tell what a standard deviation of an additional band will be, which is, the same as the value of the multiplier.
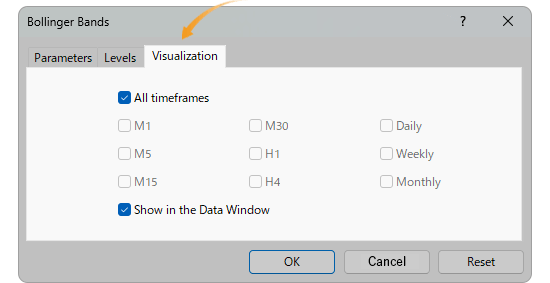
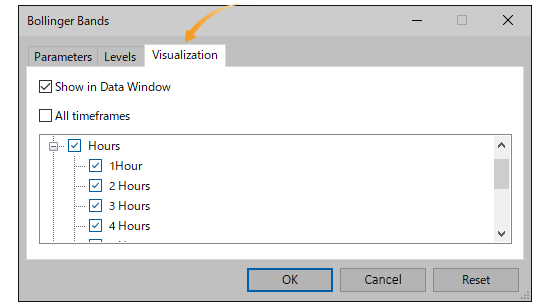
On the "Visualization" tab, you can show/hide Bollinger Bands in the Data Window and specify the timeframes to use Bollinger Bands with.
The Bollinger Band comes from the theory of standard deviation and normal distribution. Standard deviation shows how much the data (price in this case) is spread out relative to the average. The theory of normal distribution defines the probability of a data group falling within a certain range. See the figure below for more details.
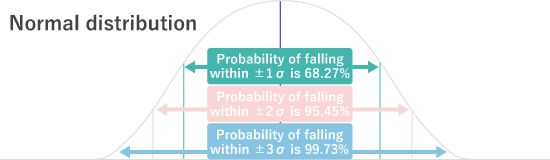
Bollinger Bands are a technical indicator that applies statistics to charts. The lines represent ±1σ, ±2σ, and ±3σ, from the center outward. However, keep in mind that markets do not always follow the rules of normal distribution.

Bollinger Bands will be displayed on the chart.The upper line of the Bollinger Bands is called the upper band, the middle one is the middle line, and the lower one is the lower band.

To display multiple Bollinger Bands on the chart, You can add a standard deviation from the "Levels" tab, or follow the same steps above to add another Bollinger Bands. Alternatively, go to the "Parameters" tab and adjust the moving average and standard deviation settings to display multiple Bollinger Bands on the same chart.
![]()
Created
: 2022.07.27
![]()
Last updated
: 2026.03.27

Nakamaru is a manual production consultant at FINTECS, a company that specializes in creating manuals for their clients.
With a wide range of experience from fintech to entertainment, he presents what user-friendly manuals should be like.
He works with numerous large corporations as an external manual production project manager.
【Business information】
http://www.fintecs.co.jp/profile/
Akira Takagi
Systems engineer, MetaTrader administrator

After graduating from Computer Science at the Uninove, Brazil, in 2014, he has worked on various systems development projects.
He participated as a developer in the launch of forex services in 2019. Since then, he has also been involved in the development of MetaTrader plugins and APIs. He is certified by MetaQuotes as a MetaTrader5 Administrator and active in consulting and advisory as well.
We hope you find this article useful. Any comments or suggestions will be greatly appreciated.
We are also looking for writers with extensive experience in forex and crypto to join us.
please contact us at [email protected].

MT4/MT5: Modify EA/indicator settings
![]() 2025.11.05
2025.11.05
![]() 2026.06.19
2026.06.19
On MetaTrader 4 (MT4) / MetaTrader 5 (MT5), you can customize the settings of Expert Advisors (EAs) and indicators applied to charts, supporting your trading strategy or visual preferences.

MT4/MT5: Create or load EA/indicator settings file
![]() 2025.10.06
2025.10.06
![]() 2026.06.19
2026.06.19
In MetaTrader 4 (MT4) and MetaTrader 5 (MT5), you can create or load a settings file to save and reuse your customized parameters. This helps save time each time you apply EAs and indicators to a chart.

MT4/MT5: Install custom indicator
![]() 2023.03.17
2023.03.17
![]() 2026.03.18
2026.03.18
On MT4/MT5, you can install indicators of your choice aside from the pre-installed technical indicators. The indicators installed by users are called custom indicators.

MT4/MT5: Backtest Expert Advisor (EA)
![]() 2022.10.28
2022.10.28
![]() 2026.03.18
2026.03.18
You can perform backtests on automated trading programs known as Expert Advisor (EA) using MT4/MT5's Strategy Tester feature. Here we will look at how to perform Expert Advisor (EA) backtests on MT4/MT5.

MT4/MT5: Save Expert Advisor (EA) testing report
![]() 2022.10.28
2022.10.28
![]() 2026.03.24
2026.03.24
Here we will look at how to save an Expert Advisor (EA) testing report on MT4/MT5. With MT4/MT5's Strategy Tester feature, you can save a result of the Expert Advisor (EA) backtest.

MT4/MT5: Install Expert Advisor (EA)
![]() 2022.10.19
2022.10.19
![]() 2026.03.25
2026.03.25
To use a third-party Expert Advisor (EA), you must first install it on MT4/MT5. Save the Expert Advisor (EA) files to the "Experts" folder of MT4/MT5, and restart MT4/MT5 to complete the installation.
Disclaimer:![]()
All information and content provided on this website is provided for informational purposes only and is not intended to solicit any investment. Although all efforts are made in order to ensure that the information is correct, no guarantee is provided for the accuracy of any content on this website. Any decision made shall be the responsibility of the investor and Myforex does not take any responsibility whatsoever regarding the use of any information provided herein.
The copyright in our content belongs to us.
We welcome your use of our content within appropriate limits, including use through our sharing features, sharing on social media, and quotation. However, please refrain from unauthorized reuse, including but not limited to commercial use, reproduction with modification of content, or reproduction on websites that compete with us. We may take necessary measures, including but not limited to deletion of the relevant content, if we consider that the content has been used in an inappropriate or unauthorized manner.
Myforex uses cookies to improve the convenience and functionality of this website. This website may include cookies not only by us but also by third parties (advertisers, log analysts, etc.) for the purpose of tracking the activities of users. Cookie policy
