Created
: 2025.06.06


![]() 2025.06.06 04:11
2025.06.06 04:11
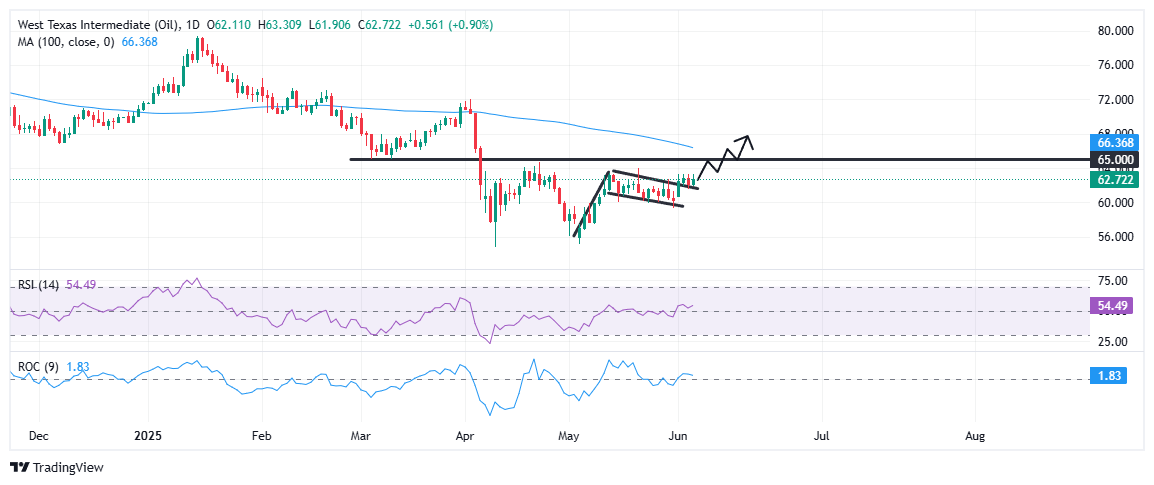
West Texas Intermediate (WTI) crude oil extends its recovery on Thursday, building on early week gains as bulls capitalize on a bullish flag breakout. At the time of writing, WTI is trading around $62.80, up nearly 1.20% on the day, and just below the intraday high of $63.30. The recent price action reflects a healthy consolidation phase following Monday's sharp 3% rally, suggesting that the upward momentum remains intact as traders eye key resistance levels ahead.
From a technical standpoint, the recent breakout from a bullish flag formation adds weight to the ongoing upside bias. This continuation setup emerged after Monday's strong rally and was followed by a modest, downward-sloping pullback -- a typical sign of profit-taking within an uptrend.
The breakout has so far held above the $62.00 level, but bulls now face a near-term test at the $63.00-$63.50 resistance zone. This range, just shy of the week's high, has acted as a short-term cap and needs to be cleared decisively to confirm bullish control and open the path toward the $65.00 psychological barrier, which has capped gains since mid-April. Furthermore, the 100-day Simple Moving Average (SMA) at $66.37 serves as the next major technical target.
On the downside, if WTI fails to hold above $62.00, prices could fall back into the flag pattern, with key support near the $60.00 round figure at the lower end of the channel. A break below that would weaken the bullish outlook.
Momentum indicators continue to support the upside setup. The 14-day Relative Strength Index (RSI) is gradually rising and currently stands at 54.49 -- comfortably above the neutral 50 mark, indicating bullish momentum without flashing overbought conditions. The Rate of Change (ROC) indicator also holds in positive territory, signaling persistent upward pressure. As long as the price holds above $62.00, the bullish breakout remains valid. However, a sustained drop below this threshold would raise the risk of a false breakout, with a potential slide back into the flag channel and the $60.00 area emerging as critical support at the lower end of the pattern.

![]()
Created
: 2025.06.06
![]()
Last updated
: 2025.06.06

FXStreet is a forex information website, delivering market analysis and news articles 24/7.
It features a number of articles contributed by well-known analysts, in addition to the ones by its editorial team.
Founded in 2000 by Francesc Riverola, a Spanish economist, it has grown to become a world-renowned information website.
We hope you find this article useful. Any comments or suggestions will be greatly appreciated.
We are also looking for writers with extensive experience in forex and crypto to join us.
please contact us at [email protected].
Disclaimer:
All information and content provided on this website is provided for informational purposes only and is not intended to solicit any investment. Although all efforts are made in order to ensure that the information is correct, no guarantee is provided for the accuracy of any content on this website. Any decision made shall be the responsibility of the investor and Myforex does not take any responsibility whatsoever regarding the use of any information provided herein.
The content provided on this website belongs to Myforex and, where stated, the relevant licensors. All rights are reserved by Myforex and the relevant licensors, and no content of this website, whether in full or in part, shall be copied or displayed elsewhere without the explicit written permission of the relevant copyright holder. If you wish to use any part of the content provided on this website, please ensure that you contact Myforex.
Myforex uses cookies to improve the convenience and functionality of this website. This website may include cookies not only by us but also by third parties (advertisers, log analysts, etc.) for the purpose of tracking the activities of users. Cookie policy