Created
: 2025.06.12


![]() 2025.06.12 13:53
2025.06.12 13:53
Gold price (XAU/USD) attracts some follow-through buyers for the second straight day and climbs to a one-week high, around the $3,377-3,378 region during the Asian session on Thursday. US President Donald Trump's fresh tariff threat offset a positive outcome from the high-stakes US-China trade talks. This, along with rising geopolitical tensions in the Middle East, tempers investors' appetite for riskier assets and drives safe-haven flows toward the bullion. Apart from this, the prevalent US Dollar (USD) selling bias is seen as another factor supporting the commodity.
Data released on Wednesday showed that US consumer prices rose at a slower-than-anticipated pace in May, reaffirming market bets that the Federal Reserve (Fed) will resume its rate-cutting cycle in September. The dovish outlook, along with the global flight to safety, leads to a further decline in the US Treasury bond yields, which drags the USD to the monthly low and benefits the non-yielding Gold price. Traders now look forward to the US macro data for some impetus, though the fundamental backdrop seems tilted in favor of the XAU/USD bulls.
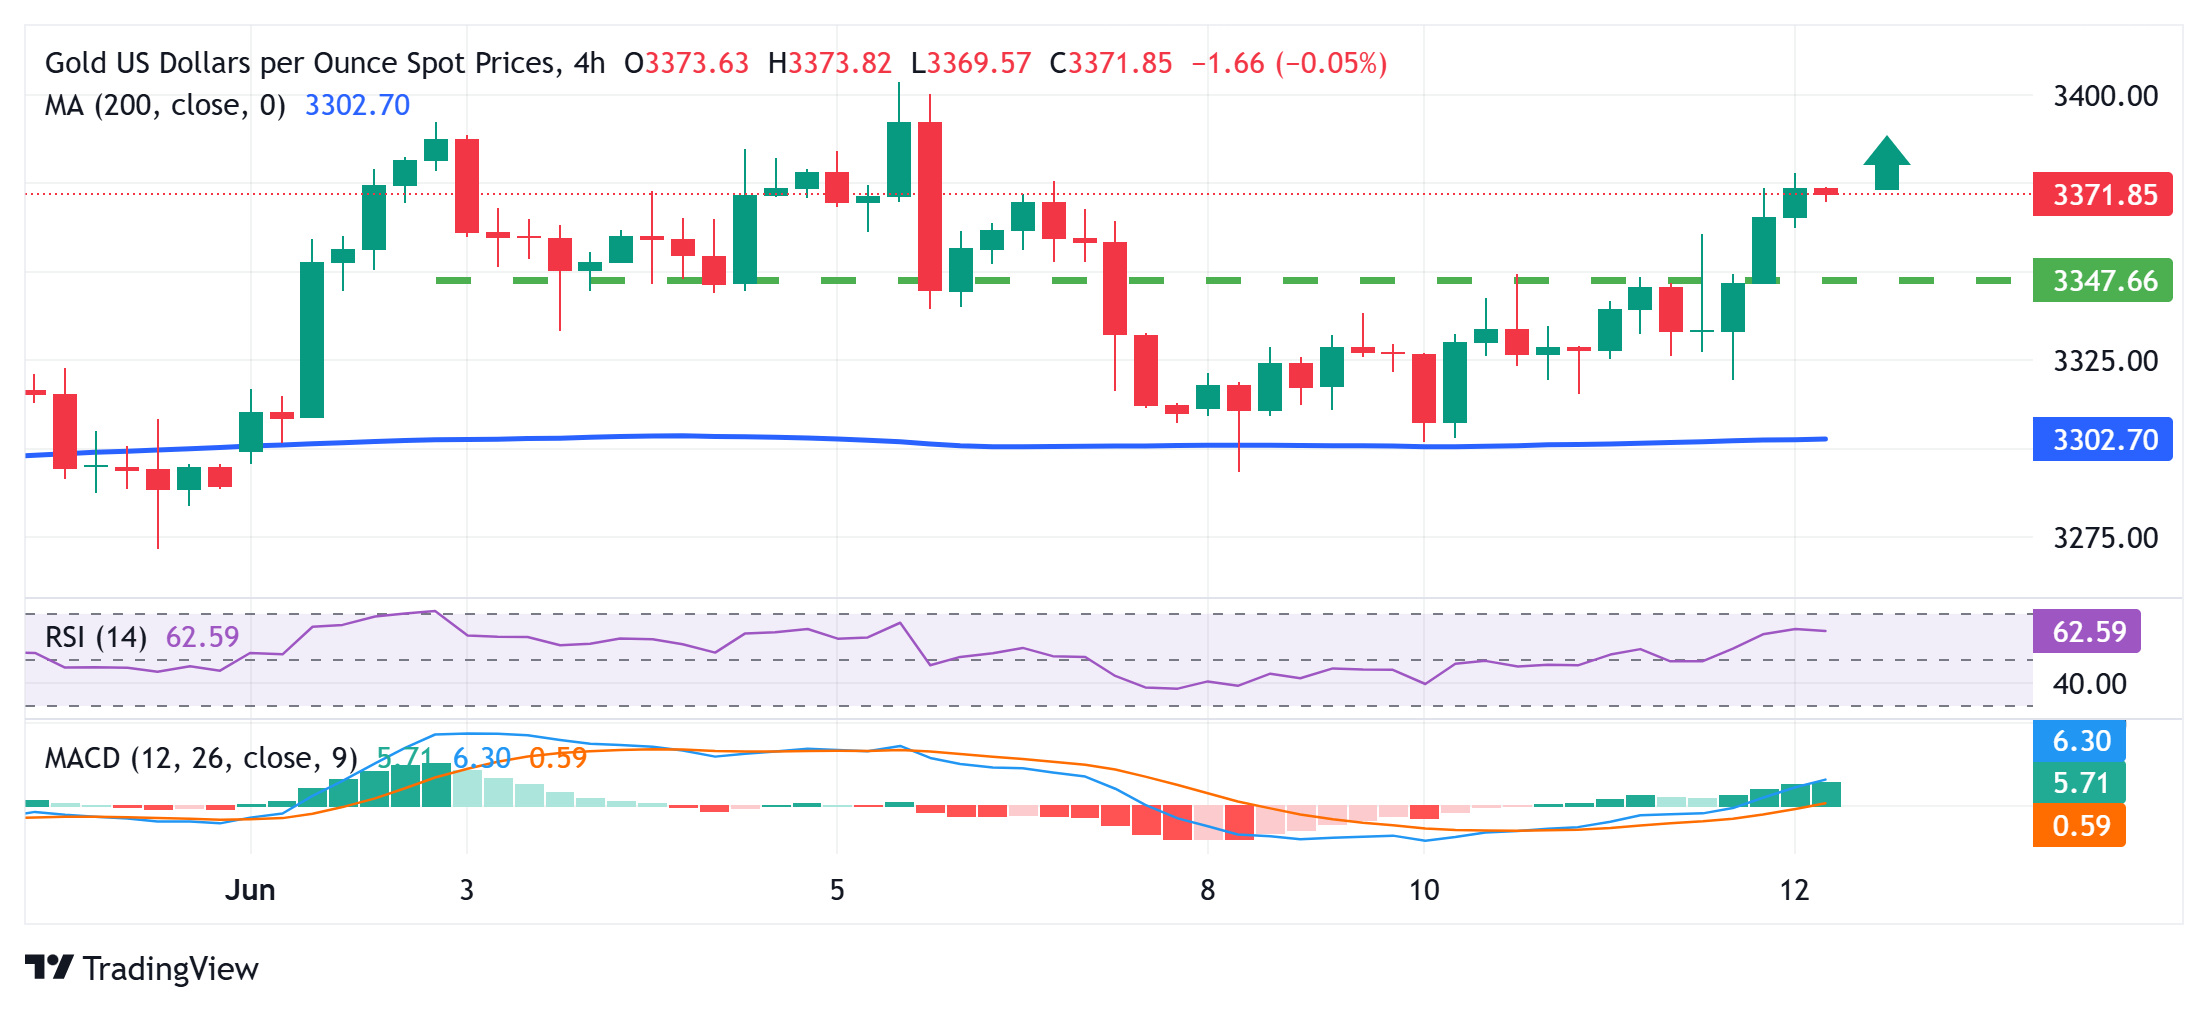
From a technical perspective, this week's rebound from the 200-period Simple Moving Average (SMA) and the subsequent strength beyond $3,348-3,350 horizontal resistance favors the XAU/USD bulls. This, along with positive oscillators on daily/hourly charts, validates the near-term constructive outlook and should allow the Gold price to climb further towards reclaiming the $3,400 round figure. Some follow-through buying should pave the way for an extension of the momentum to the $3,430-3,435 region, above which the commodity could aim to retest the all-time peak, around the $3,500 psychological mark touched in April.
On the flip side, the aforementioned resistance breakpoint, around the $3,350-3.348 area, now seems to protect the immediate downside. Any further pullback could be seen as a buying opportunity near the $3.323-3,322 region. This should help limit the downside for the Gold price near the $3,300 round figure, or the 200-period SMA on the 4-hour chart. The latter should act as a pivotal point, which if broken would shift the near-term bias in favor of bearish traders.
The table below shows the percentage change of US Dollar (USD) against listed major currencies today. US Dollar was the strongest against the Australian Dollar.
| USD | EUR | GBP | JPY | CAD | AUD | NZD | CHF | |
|---|---|---|---|---|---|---|---|---|
| USD | -0.25% | -0.26% | -0.37% | -0.10% | 0.10% | -0.06% | -0.44% | |
| EUR | 0.25% | -0.01% | -0.12% | 0.15% | 0.32% | 0.18% | -0.17% | |
| GBP | 0.26% | 0.01% | -0.12% | 0.16% | 0.33% | 0.18% | -0.18% | |
| JPY | 0.37% | 0.12% | 0.12% | 0.27% | 0.45% | 0.26% | -0.06% | |
| CAD | 0.10% | -0.15% | -0.16% | -0.27% | 0.20% | 0.02% | -0.34% | |
| AUD | -0.10% | -0.32% | -0.33% | -0.45% | -0.20% | -0.14% | -0.50% | |
| NZD | 0.06% | -0.18% | -0.18% | -0.26% | -0.02% | 0.14% | -0.36% | |
| CHF | 0.44% | 0.17% | 0.18% | 0.06% | 0.34% | 0.50% | 0.36% |
The heat map shows percentage changes of major currencies against each other. The base currency is picked from the left column, while the quote currency is picked from the top row. For example, if you pick the US Dollar from the left column and move along the horizontal line to the Japanese Yen, the percentage change displayed in the box will represent USD (base)/JPY (quote).
![]()
Created
: 2025.06.12
![]()
Last updated
: 2025.06.12

FXStreet is a forex information website, delivering market analysis and news articles 24/7.
It features a number of articles contributed by well-known analysts, in addition to the ones by its editorial team.
Founded in 2000 by Francesc Riverola, a Spanish economist, it has grown to become a world-renowned information website.
We hope you find this article useful. Any comments or suggestions will be greatly appreciated.
We are also looking for writers with extensive experience in forex and crypto to join us.
please contact us at [email protected].
Disclaimer:![]()
All information and content provided on this website is provided for informational purposes only and is not intended to solicit any investment. Although all efforts are made in order to ensure that the information is correct, no guarantee is provided for the accuracy of any content on this website. Any decision made shall be the responsibility of the investor and Myforex does not take any responsibility whatsoever regarding the use of any information provided herein.
The content provided on this website belongs to Myforex and, where stated, the relevant licensors. All rights are reserved by Myforex and the relevant licensors, and no content of this website, whether in full or in part, shall be copied or displayed elsewhere without the explicit written permission of the relevant copyright holder. If you wish to use any part of the content provided on this website, please ensure that you contact Myforex.
Myforex uses cookies to improve the convenience and functionality of this website. This website may include cookies not only by us but also by third parties (advertisers, log analysts, etc.) for the purpose of tracking the activities of users. Cookie policy
