Select Language

Oil Price Forecast: WTI rallies to $74 before settling above $72

Breaking news

Oil Price Forecast: WTI rallies to $74 before settling above $72

  • X
  • facebook
  • LINE
  • RSS

  • X
  • facebook
  • LINE
  • RSS
New update 2025.06.14 05:49
Oil Price Forecast: WTI rallies to $74 before settling above $72

update 2025.06.14 05:49

  • WTI Oil surges above $72 as Israel-Iran tensions trigger a breakout.
  • Gains for June are near 20%, pushing prices above key Fibonacci levels from longer-term moves.
  • The 12-month moving average provides additional support below $70.

WTI crude oil is surging amid escalating geopolitical tensions, with Israel's recent strikes on Iran fueling a rally that pushed prices above the $74.00 handle on Friday. At the time of writing, WTI is trading just below $72.00 after Iran responded with its own missile barrage, marking a near 20% gain for June and reversing much of the weakness observed earlier this year.

Despite broad-based pressure in the first half of 2025, the recent price surge has lifted WTI back above several key technical levels, with bullish momentum building across multiple timeframes.

WTI Oil long-term setup

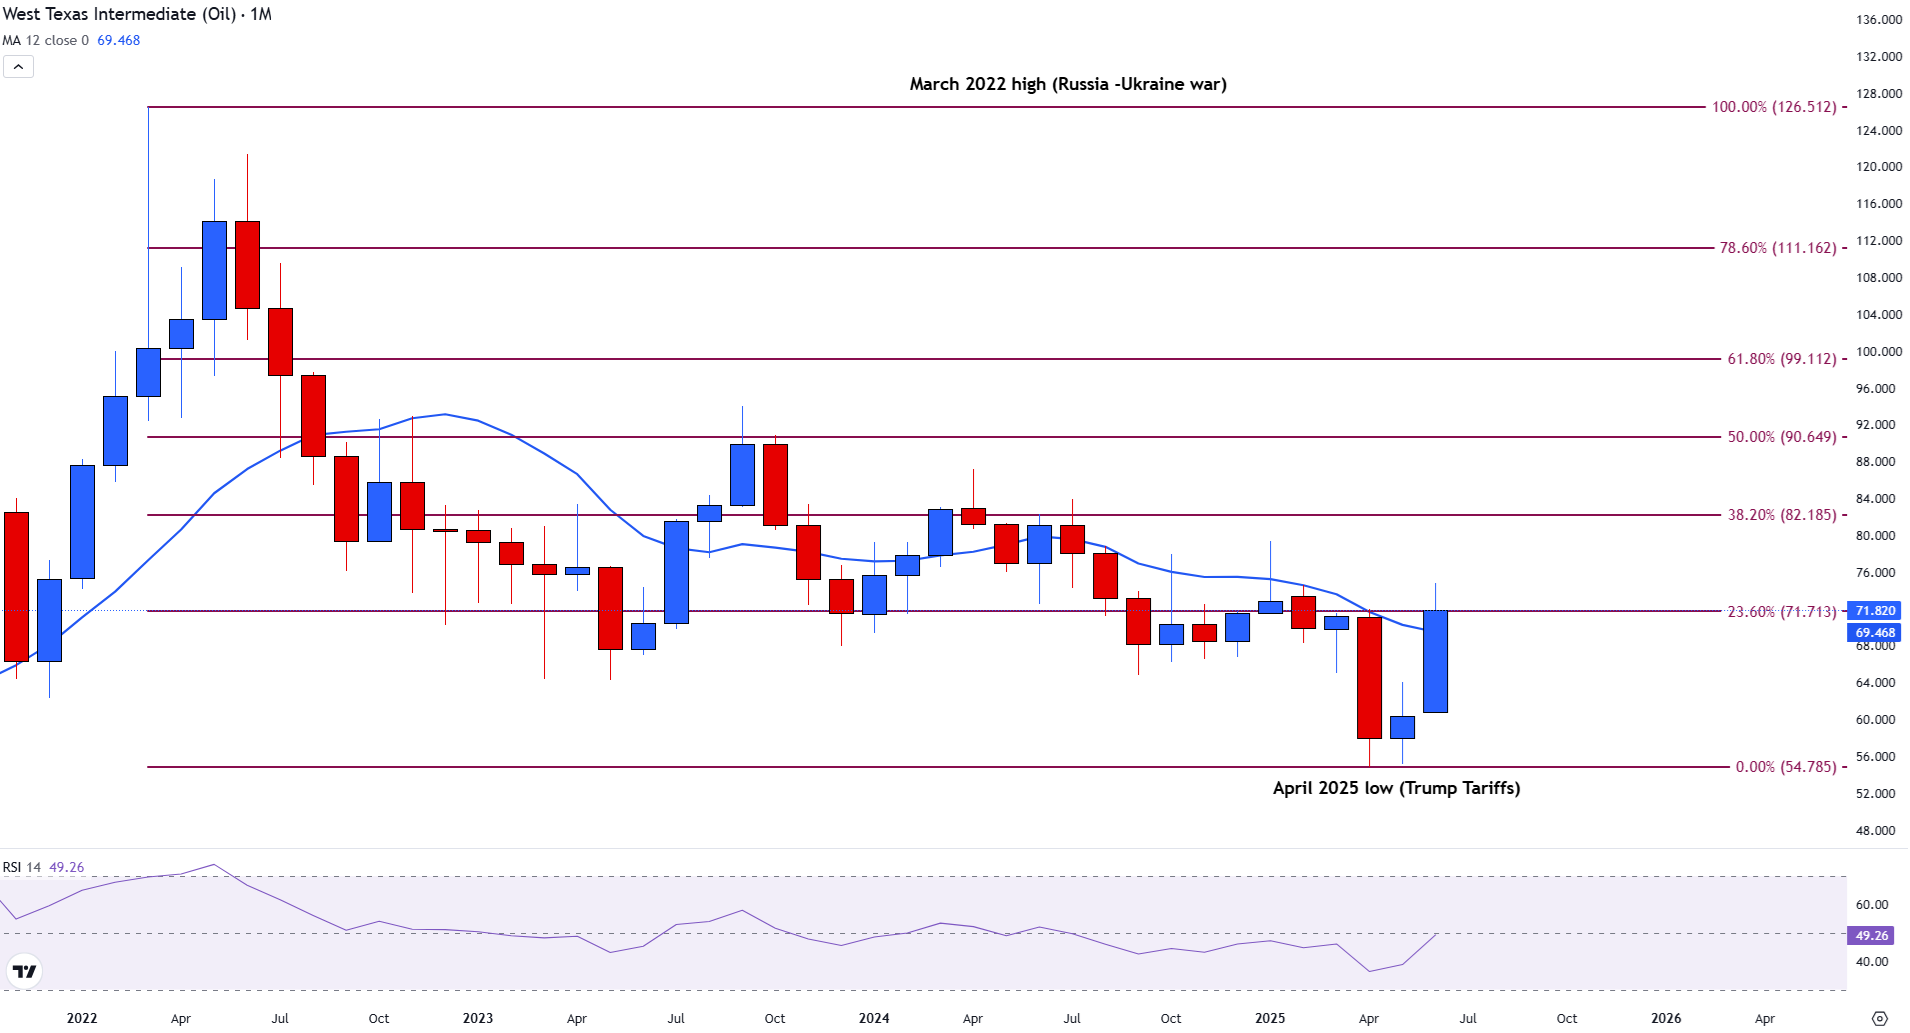
From a longer-term perspective, WTI has reclaimed the 12-month Simple Moving Average (SMA), currently sitting at $69.46. This level now serves as dynamic support. Above, resistance is forming at the 23.6% Fibonacci retracement of the March 2022 high to the April 2025 low, located at $71.71.

WTI Oil Monthly Chart

WTI Oil medium-term setup

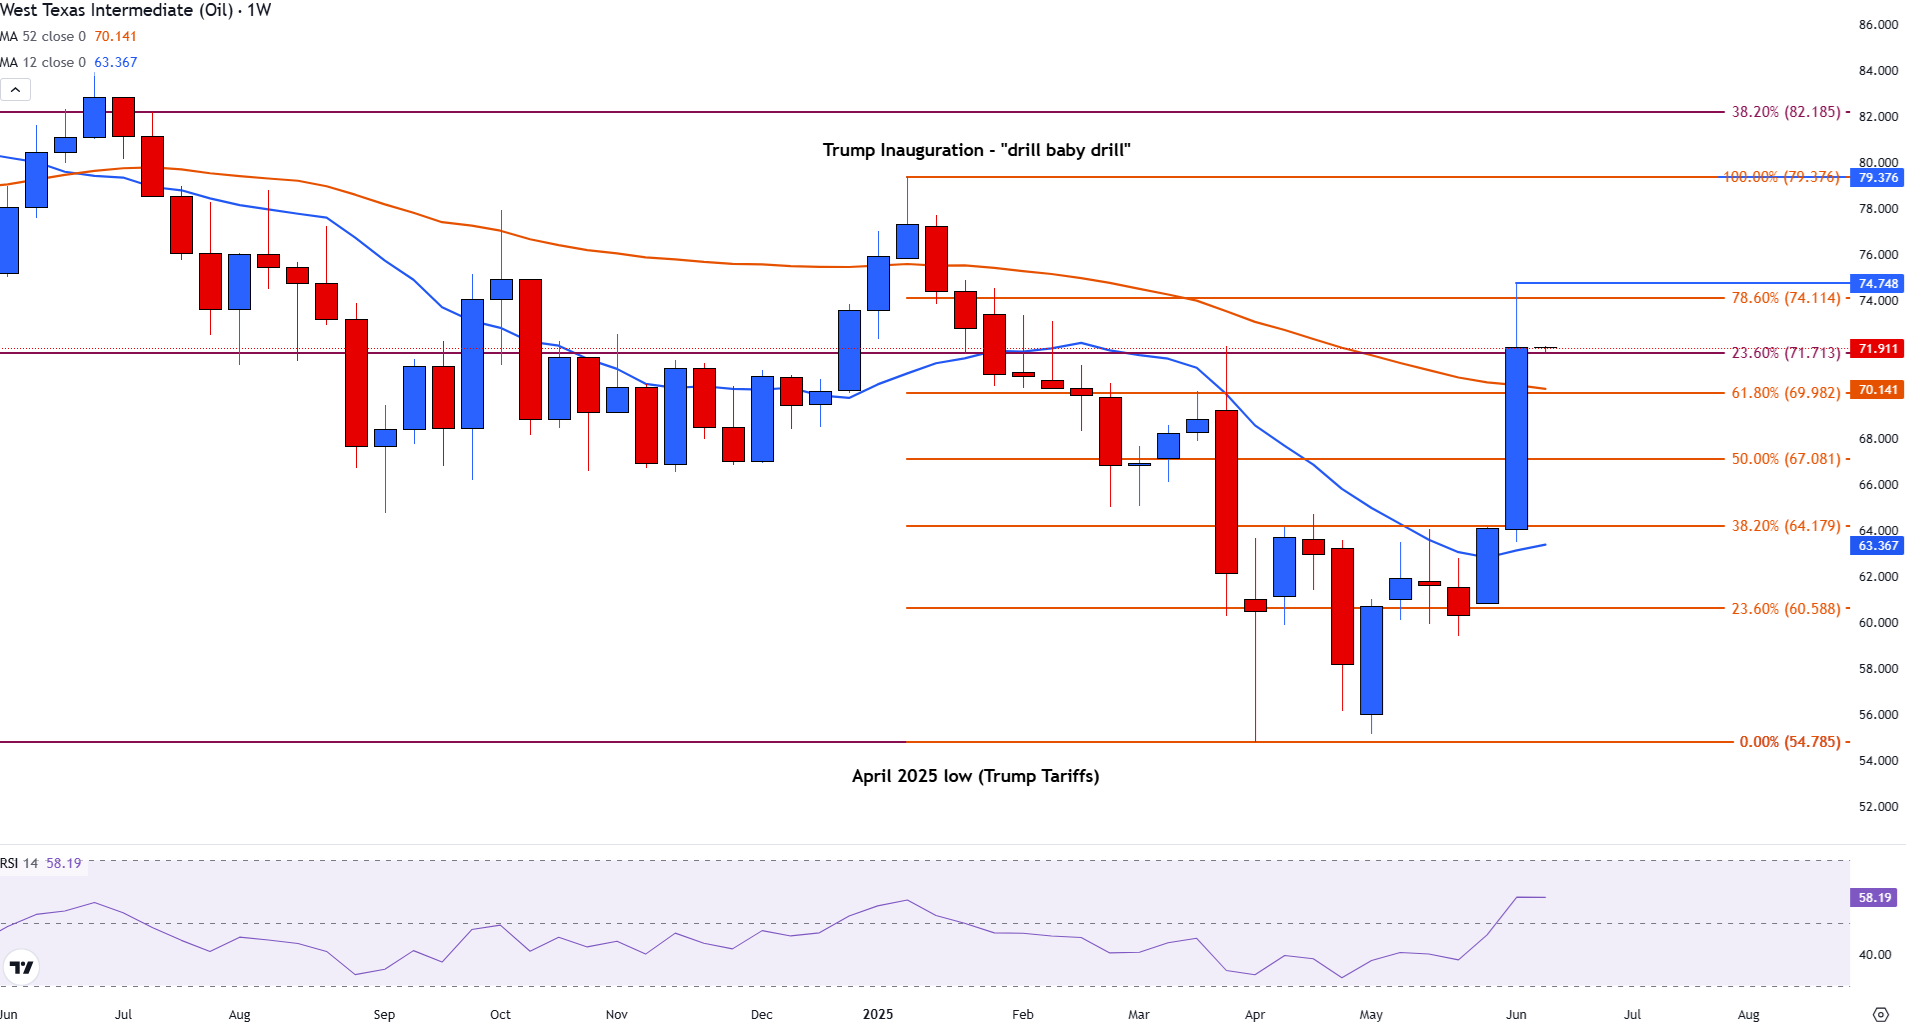
On the weekly chart, WTI broke above the 12-week SMA at $63.29 following the Iran-Israel escalation, marking a pivotal shift in sentiment. This surge has brought prices up to the 78.6% Fibonacci retracement of the January-April decline at $74.11. The 12-week SMA continues to offer support near $63.31, underlining a strong base for bulls.

WTI Oil Weekly Chart

WTI Oil short-term setup

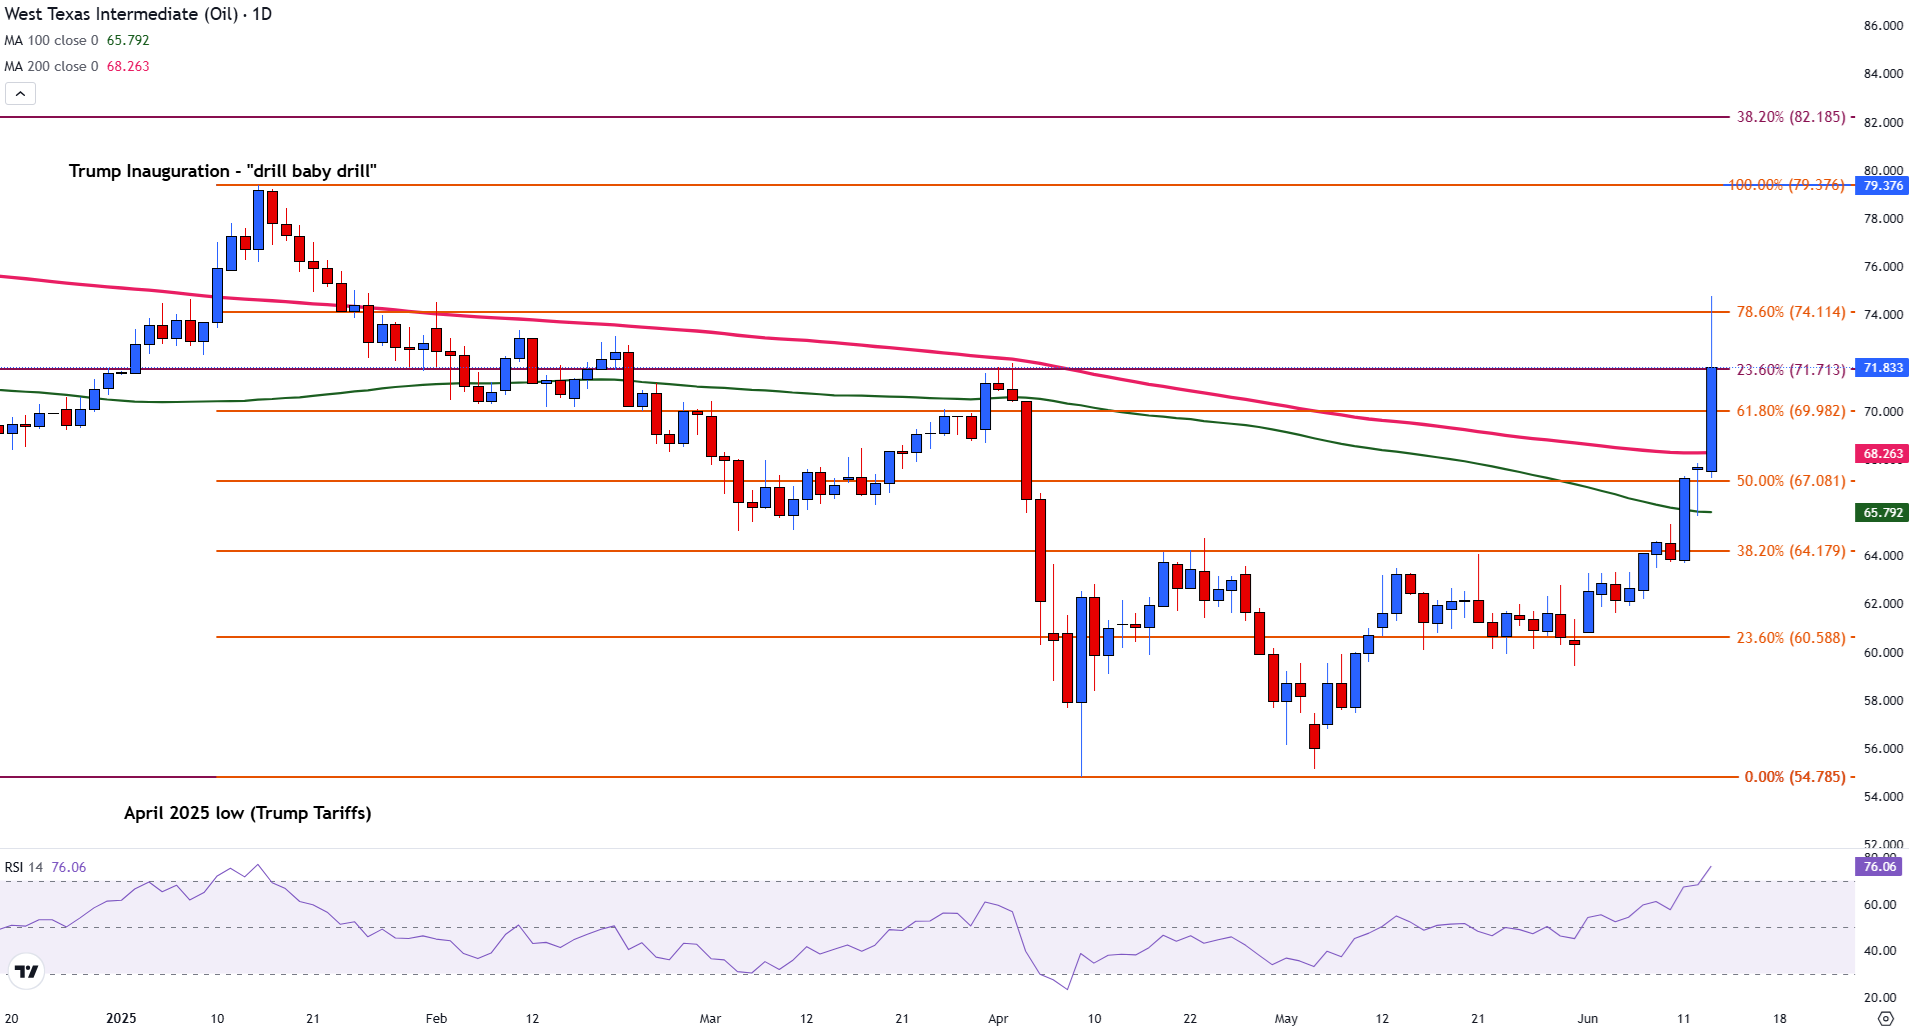
Zooming into the daily chart, Friday's bullish momentum drove a decisive move above both the 100-day and 200-day SMAs, strengthening the case for further upside. Technical confluence with long-term Fibonacci levels adds credibility to the breakout.

The Relative Strength Index (RSI) on the daily timeframe currently sits at 76, signaling overbought conditions. However, with the geopolitical backdrop intensifying, fundamental support may ultimately prevail over short-term exhaustion.

WTI Oil Daily Chart

Looking ahead: What's next for Oil?

If WTI breaks and holds above $74.11 early next week, momentum could carry it toward $76.00 and eventually $78.00. Conversely, failure to maintain levels above $71.71 may trigger a retracement, especially if geopolitical tensions ease or if market focus returns to demand-side concerns.


Date

Created

 : 2025.06.14

Update

Last updated

 : 2025.06.14

Related articles


Show more

FXStreet

Financial media

arrow
FXStreet

FXStreet is a forex information website, delivering market analysis and news articles 24/7.
It features a number of articles contributed by well-known analysts, in addition to the ones by its editorial team.
Founded in 2000 by Francesc Riverola, a Spanish economist, it has grown to become a world-renowned information website.

Was this article helpful?

We hope you find this article useful. Any comments or suggestions will be greatly appreciated.  
We are also looking for writers with extensive experience in forex and crypto to join us.

please contact us at [email protected].

Thank you for your feedback.

Most viewed

USD/CHF Price Forecast: Posts weekly loss, despite Friday rebound to 0.8100

The USD/CHF ended Friday's session with gains of over 0.04%, but in the week fell over 1.37% to a one-month low of 0.8054. At the time of writing, the pair trades at 0.8104 due to increased demand for the Dollar amid risk aversion.
New
update2025.06.14 06:54

Oil Price Forecast: WTI rallies to $74 before settling above $72

WTI crude oil is surging amid escalating geopolitical tensions, with Israel's recent strikes on Iran fueling a rally that pushed prices above the $74.00 handle on Friday.
New
update2025.06.14 05:48

Canadian Dollar continues to ride Greenback weakness to new highs

The Canadian Dollar (CAD) caught yet another bid on Friday, climbing into new eight-month highs as the US Dollar (USD) holds in place and Crude Oil prices surge.
New
update2025.06.14 05:08

EUR/USD retreats as Israel-Iran conflict jolts markets, ends 4-day rally

EUR/USD ends four-day winning streak, prints losses on Friday as risk appetite takes a hit after Israel launched an attack on Iran, boosting the safe-haven appeal of the US Dollar (USD). At the time of writing, the pair trades around 1.1530, down 0.36%.
New
update2025.06.14 04:56

AUD/USD retreats as geopolitical risks increase, limiting US Dollar weakness

The Australian Dollar (AUD) is weakening against the US Dollar (USD) on Friday, with price action being guided by a combination of factors. 
New
update2025.06.14 04:18

USD/JPY recovers above 144.00 on Israel-Iran tensions, cautious BoJ

The Japanese Yen (JPY) is trading weaker against the US Dollar (USD) on Friday, as geopolitical tensions and central bank policy divergence drive market flows. 
New
update2025.06.14 03:21

Gold surges past $3,400 on Israel-Iran war risk, soft US inflation boosts safe-haven demand

Gold price rallied for the third consecutive day after the Israel-Iran conflict erupted on Friday, triggering a risk-off mood in financial markets as fears that it could escalate loom. At the time of writing, XAU/USD trades at $3,422, up more than 1%.
New
update2025.06.14 02:52

USD/CAD breaks 1.3600 as US Dollar weakness returns

The Canadian Dollar (CAD) is trading higher against the US Dollar (USD) in the American session on Friday, with the Loonie erasing gains from earlier sessions.
New
update2025.06.14 02:23

Dow Jones Industrial Average erases gains on renewed geopolitical tensions

The Dow Jones Industrial Average (DJIA) fell on Friday, shedding over 600 points from the previous day's close as investors pulled back following Israel's unexpected wave of strikes on Iran. Consumer sentiment data rebounded more than expected, helping to ease Friday's downside momentum.
New
update2025.06.14 00:29

GBP/USD plunges as Israel-Iran conflict rattles markets, boosts US Dollar

GBP/USD tumbled over 0.40% on Friday as geopolitical tensions triggered a flow towards the Dollar haven status after Israel launched an attack on Iran, which escalated the Middle East conflict. The pair traded near 1.3550s after hitting a yearly peak of 1.3631.
New
update2025.06.14 00:14

Disclaimer:arw

All information and content provided on this website is provided for informational purposes only and is not intended to solicit any investment. Although all efforts are made in order to ensure that the information is correct, no guarantee is provided for the accuracy of any content on this website. Any decision made shall be the responsibility of the investor and Myforex does not take any responsibility whatsoever regarding the use of any information provided herein.

The content provided on this website belongs to Myforex and, where stated, the relevant licensors. All rights are reserved by Myforex and the relevant licensors, and no content of this website, whether in full or in part, shall be copied or displayed elsewhere without the explicit written permission of the relevant copyright holder. If you wish to use any part of the content provided on this website, please ensure that you contact Myforex.

  • Facebook
  • Twitter
  • LINE

Myforex uses cookies to improve the convenience and functionality of this website. This website may include cookies not only by us but also by third parties (advertisers, log analysts, etc.) for the purpose of tracking the activities of users. Cookie policy

I agree
share
Share
Cancel