
Created
: 2025.10.24


![]() 2025.10.24 10:47
2025.10.24 10:47
The Australian Dollar (AUD) steadies against the US Dollar (USD) after the release of the preliminary S&P Global Purchasing Managers Index (PMI) on Friday. Traders await key quarterly inflation data for Australia next week that could shape the Reserve Bank of Australia's (RBA) policy outlook.
The preliminary Australia's S&P Global Manufacturing Purchasing Managers Index (PMI) fell to 49.7 in October from 51.4 prior. Meanwhile, Services PMI rose to 53.1 in October from the previous reading of 52.4, while the Composite PMI increased to 52.6 in October against 52.4 prior.
RBA Governor Michele Bullock spoke in Sydney but made no comments on monetary policy or the economy. Bullock stated that starting next year, the central bank will consider ways to modernize the interbank settlement system, which processes around A$300 billion ($194.94 billion) in daily transactions and plays a key role in the payments infrastructure, per Reuters.
The AUD could face challenges amid growing bets of a near-term rate cut by the Reserve Bank of Australia (RBA). Australia's latest employment report threw an unexpected curveball, with the jobless rate climbing to its highest level in nearly four years this September. The surprise spike jolted markets into upping the odds of a 25-basis-point rate cut to 70%, a sharp jump from roughly 40% just a week prior.
The White House confirmed on Thursday that President Donald Trump will meet Chinese leader Xi Jinping next week, coinciding with another round of high-level trade talks scheduled for this weekend during the ASEAN Summit. Any shift in China's economic conditions could also affect the Australian dollar (AUD), given the close trade ties between China and Australia.
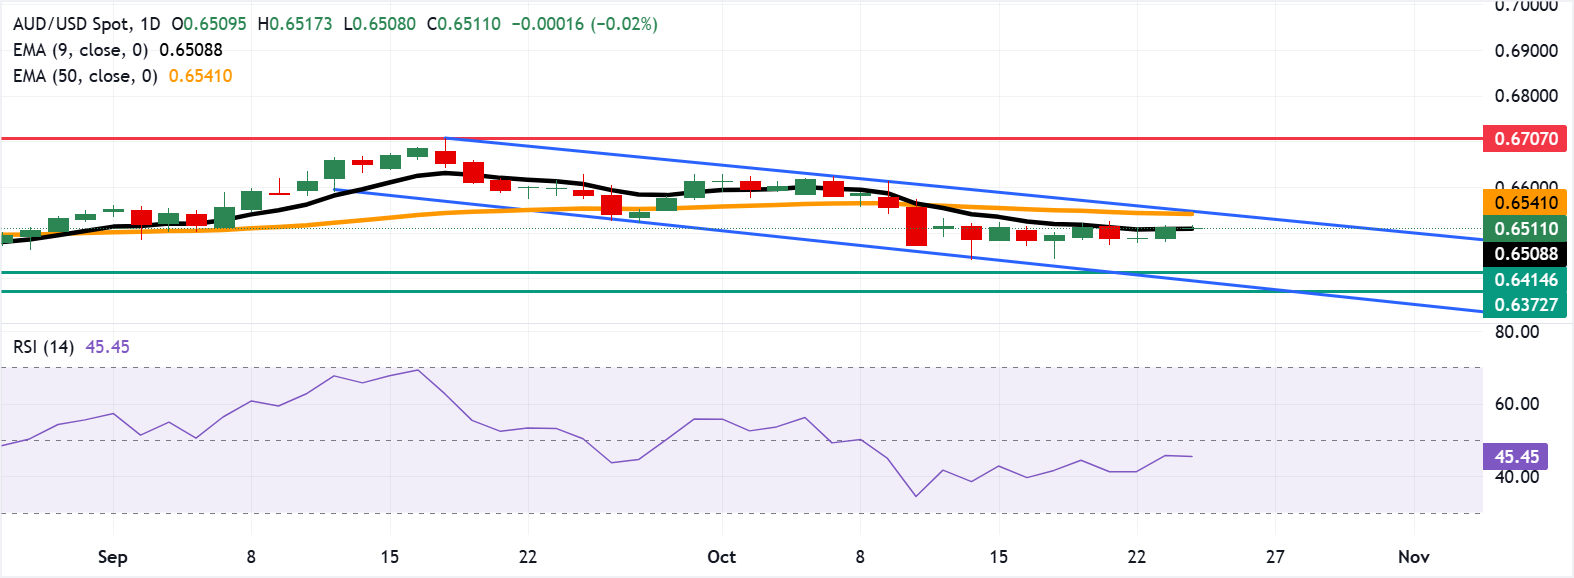
AUD/USD is trading around 0.6510 on Friday. Technical analysis of a daily chart suggests a persistent bearish bias, with the pair trading within a descending channel. The 14-day RSI remains below 50, strengthening the bearish outlook.
On the downside, the AUD/USD pair may navigate the area around the four-month low of 0.6414, followed by the lower boundary of the descending channel around 0.6390. A break below this confluence support zone would strengthen the bearish bias and prompt the pair to test the five-month low of 0.6372.
The AUD/USD pair is hovering around the nine-day Exponential Moving Average (EMA) at 0.6508. A successful break above this level would improve the short-term price momentum and support the pair to test the 50-day EMA at 0.6541, aligned with the descending channel's upper boundary.
The table below shows the percentage change of Australian Dollar (AUD) against listed major currencies today. Australian Dollar was the strongest against the Japanese Yen.
| USD | EUR | GBP | JPY | CAD | AUD | NZD | CHF | |
|---|---|---|---|---|---|---|---|---|
| USD | 0.07% | 0.01% | 0.18% | -0.00% | 0.02% | 0.03% | 0.05% | |
| EUR | -0.07% | -0.05% | 0.11% | -0.05% | -0.04% | -0.03% | -0.01% | |
| GBP | -0.01% | 0.05% | 0.16% | -0.01% | 0.01% | 0.00% | 0.04% | |
| JPY | -0.18% | -0.11% | -0.16% | -0.17% | -0.16% | -0.16% | -0.13% | |
| CAD | 0.00% | 0.05% | 0.01% | 0.17% | 0.01% | 0.03% | 0.04% | |
| AUD | -0.02% | 0.04% | -0.01% | 0.16% | -0.01% | 0.00% | 0.02% | |
| NZD | -0.03% | 0.03% | -0.00% | 0.16% | -0.03% | -0.00% | 0.02% | |
| CHF | -0.05% | 0.01% | -0.04% | 0.13% | -0.04% | -0.02% | -0.02% |
The heat map shows percentage changes of major currencies against each other. The base currency is picked from the left column, while the quote currency is picked from the top row. For example, if you pick the Australian Dollar from the left column and move along the horizontal line to the US Dollar, the percentage change displayed in the box will represent AUD (base)/USD (quote).
The Composite Purchasing Managers Index (PMI), released on a monthly basis by S&P Global, is a leading indicator gauging private-business activity in Australia for both the manufacturing and services sectors. The data is derived from surveys to senior executives. Each response is weighted according to the size of the company and its contribution to total manufacturing or services output accounted for by the sub-sector to which that company belongs. Survey responses reflect the change, if any, in the current month compared to the previous month and can anticipate changing trends in official data series such as Gross Domestic Product (GDP), industrial production, employment and inflation. The index varies between 0 and 100, with levels of 50.0 signaling no change over the previous month. A reading above 50 indicates that the Australian private economy is generally expanding, a bullish sign for the Australian Dollar (AUD). Meanwhile, a reading below 50 signals that activity is generally declining, which is seen as bearish for AUD.
Read more.Last release: Thu Oct 23, 2025 22:00 (Prel)
Frequency: Monthly
Actual: 52.6
Consensus: -
Previous: 52.4
Source: S&P Global
![]()
Created
: 2025.10.24
![]()
Last updated
: 2025.10.24

FXStreet is a forex information website, delivering market analysis and news articles 24/7.
It features a number of articles contributed by well-known analysts, in addition to the ones by its editorial team.
Founded in 2000 by Francesc Riverola, a Spanish economist, it has grown to become a world-renowned information website.
We hope you find this article useful. Any comments or suggestions will be greatly appreciated.
We are also looking for writers with extensive experience in forex and crypto to join us.
please contact us at [email protected].
Disclaimer:![]()
All information and content provided on this website is provided for informational purposes only and is not intended to solicit any investment. Although all efforts are made in order to ensure that the information is correct, no guarantee is provided for the accuracy of any content on this website. Any decision made shall be the responsibility of the investor and Myforex does not take any responsibility whatsoever regarding the use of any information provided herein.
The content provided on this website belongs to Myforex and, where stated, the relevant licensors. All rights are reserved by Myforex and the relevant licensors, and no content of this website, whether in full or in part, shall be copied or displayed elsewhere without the explicit written permission of the relevant copyright holder. If you wish to use any part of the content provided on this website, please ensure that you contact Myforex.
Myforex uses cookies to improve the convenience and functionality of this website. This website may include cookies not only by us but also by third parties (advertisers, log analysts, etc.) for the purpose of tracking the activities of users. Cookie policy
