Created
: 2025.09.10


![]() 2025.09.10 00:13
2025.09.10 00:13
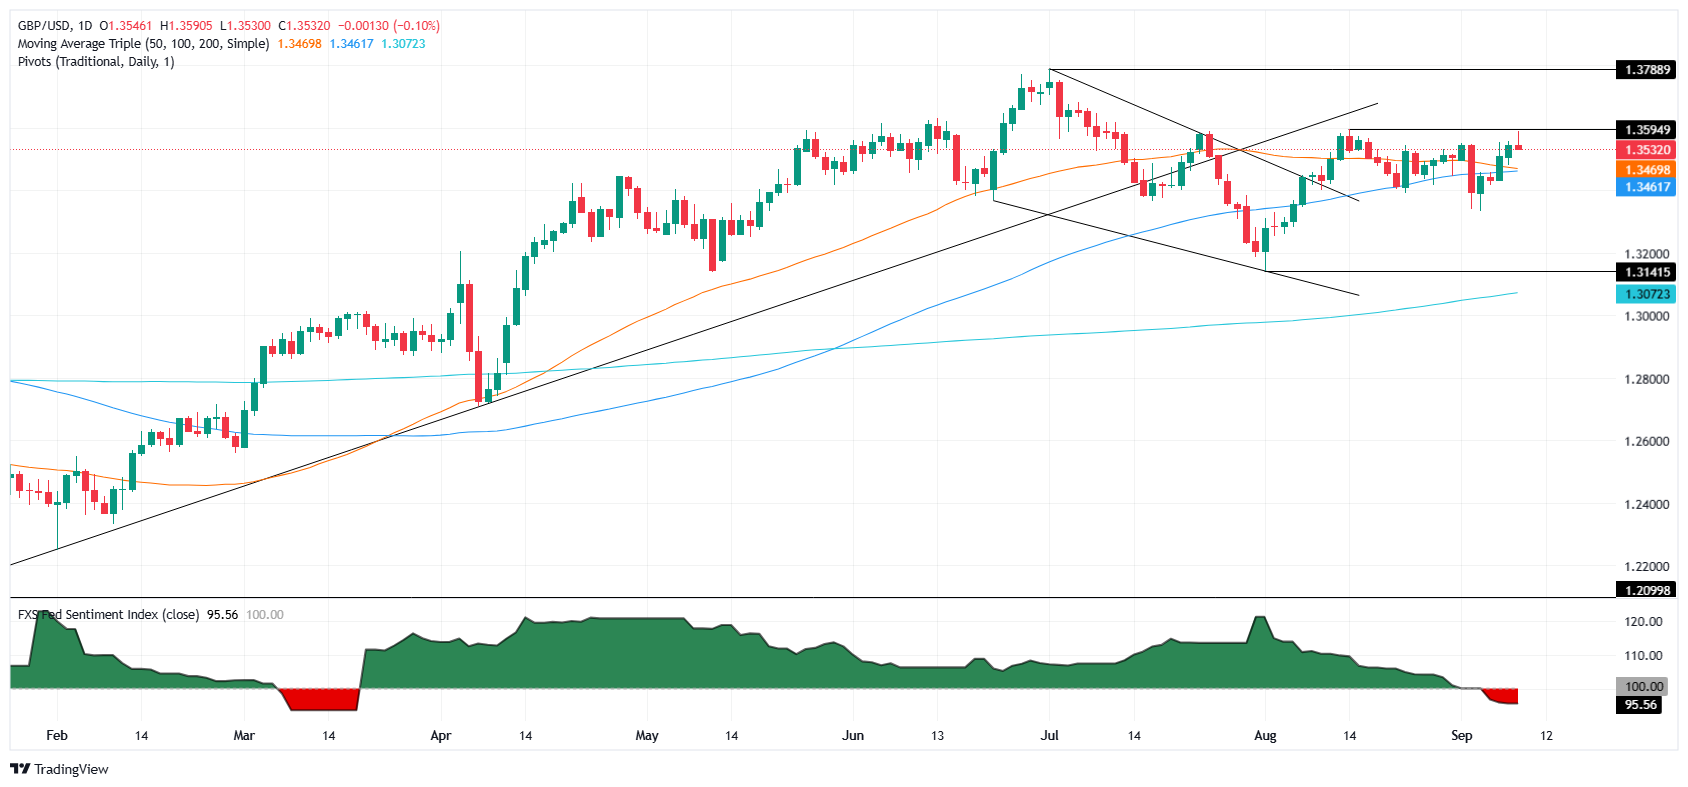
The GBP/USD retreats during the North American session after the latest Nonfarm Payrolls revision, was worse than expected, according to Bloomberg estimates. At the time of writing, the pair trades at 1.3542 after hitting a daily high of 1.3590, down 0.01%.
The US Bureau of Labor Statistics (BLS) revealed the preliminary benchmark total payroll revisions since March 2025, which witnessed a downward revision of -911K. Ahead of the report, the US government revealed that the economy added nearly 1.8 million to the work force in a year through March.
Today's data barely moved the needle in regards of traders expecting a rate cut by the Fed. Since last week's Nonfarm Payroll figures, odds for a 25 basis points (bps) rate cut are fully priced in, but a minority at around 9%, expect a 50 bps cut by the US central bank.
Across the pond, the UK Retail Sales in August revealed by the British Retail Consortium (BRC) grew 3.1% YoY up from a previous reading of 1% a year ago. Despite this, the BRC Chief Executive Helen Dickinson said that "With the later-than-expected Budget falling just days before Black Friday, many are uneasy about how consumer confidence and spending could be impacted by tax rise speculation in the run-up to Christmas."
Market participants' eyes are focused on the release of the Producer Price Index (PPI) figures in the US on Wednesday, followed by Thursday's busy schedule lead by the Consumer Price Index (CPI) and Initial Jobless Claims data.
Across the pond, traders will eye the manufacturing output report and Gross Domestic Product (GDP) figures toward the end of the year.
The GBP/USD is set to remain consolidated after failing to challenge July's peak of 1.3681, which could've opened the door to test 1.3700 and the yearly peak of 1.3788. The Relative Strength Index (RSI) shows that bullish momentum stalled. Hence, a pullback could be on the cards.
If GBP/USD tumbles below 1.3500, expect a test of the 20-day SMA At 1.3493. A breach of the latter will expose the 50-day SMA at 1.3466, followed by the 100-day SMA at 1.3457.
The table below shows the percentage change of British Pound (GBP) against listed major currencies this week. British Pound was the strongest against the US Dollar.
| USD | EUR | GBP | JPY | CAD | AUD | NZD | CHF | |
|---|---|---|---|---|---|---|---|---|
| USD | -0.08% | -0.20% | -0.68% | -0.03% | -0.51% | -0.55% | -0.32% | |
| EUR | 0.08% | -0.14% | -0.50% | 0.04% | -0.42% | -0.43% | -0.25% | |
| GBP | 0.20% | 0.14% | -0.48% | 0.17% | -0.29% | -0.30% | -0.11% | |
| JPY | 0.68% | 0.50% | 0.48% | 0.57% | 0.13% | -0.04% | 0.37% | |
| CAD | 0.03% | -0.04% | -0.17% | -0.57% | -0.38% | -0.47% | -0.30% | |
| AUD | 0.51% | 0.42% | 0.29% | -0.13% | 0.38% | -0.00% | 0.18% | |
| NZD | 0.55% | 0.43% | 0.30% | 0.04% | 0.47% | 0.00% | 0.19% | |
| CHF | 0.32% | 0.25% | 0.11% | -0.37% | 0.30% | -0.18% | -0.19% |
The heat map shows percentage changes of major currencies against each other. The base currency is picked from the left column, while the quote currency is picked from the top row. For example, if you pick the British Pound from the left column and move along the horizontal line to the US Dollar, the percentage change displayed in the box will represent GBP (base)/USD (quote).
![]()
Created
: 2025.09.10
![]()
Last updated
: 2025.09.10

FXStreet is a forex information website, delivering market analysis and news articles 24/7.
It features a number of articles contributed by well-known analysts, in addition to the ones by its editorial team.
Founded in 2000 by Francesc Riverola, a Spanish economist, it has grown to become a world-renowned information website.
We hope you find this article useful. Any comments or suggestions will be greatly appreciated.
We are also looking for writers with extensive experience in forex and crypto to join us.
please contact us at [email protected].
Disclaimer:![]()
All information and content provided on this website is provided for informational purposes only and is not intended to solicit any investment. Although all efforts are made in order to ensure that the information is correct, no guarantee is provided for the accuracy of any content on this website. Any decision made shall be the responsibility of the investor and Myforex does not take any responsibility whatsoever regarding the use of any information provided herein.
The content provided on this website belongs to Myforex and, where stated, the relevant licensors. All rights are reserved by Myforex and the relevant licensors, and no content of this website, whether in full or in part, shall be copied or displayed elsewhere without the explicit written permission of the relevant copyright holder. If you wish to use any part of the content provided on this website, please ensure that you contact Myforex.
Myforex uses cookies to improve the convenience and functionality of this website. This website may include cookies not only by us but also by third parties (advertisers, log analysts, etc.) for the purpose of tracking the activities of users. Cookie policy
