Created
: 2025.09.03


![]() 2025.09.03 11:14
2025.09.03 11:14
The Australian Dollar (AUD) moves little against the US Dollar (USD) on Wednesday after registering 0.5% gains in the previous session. The AUD/USD pair remains subdued following Australia's Q2 Gross Domestic Product ( Caixin Services Purchasing Managers' Index (PMI). The US JOLTS Job Openings and the Fed Beige Book will be eyed later in the day.
The Australian Bureau of Statistics (ABS) reported that Gross Domestic Product rose 0.6% quarter-over-quarter in the second quarter, following the 0.3% growth in Q1 (revised from 0.2%). This reading came in stronger than the expectations of 0.5% expansion. The annual Q2 GDP grew by 1.8%, compared with the 1.4% growth in Q1 (revised from 1.3%), and was above the consensus of a 1.6% increase.
China's Caixin Services Purchasing Managers' Index unexpectedly rose to 53.0 in August from 52.6 in July. The data came in above the market forecast of 52.5 in the reported period.
The US Dollar Index (DXY), which measures the value of the US Dollar against six major currencies, is extending gains for the second successive day and trading around 98.50 at the time of writing. The US Dollar gains ground amid increased safe-haven demand, driven by market caution in the financial markets and the ongoing Russia-Ukraine conflict.
However, the upside of the Greenback could be restrained due to the prospect of the US Federal Reserve (Fed) rate cut this month, along with the dovish remarks from Fed officials. The CME FedWatch tool indicates pricing in more than 91% of a 25-basis-point (bps) rate cut by the Fed at the September policy meeting, up from an 86% chance a day ago.
Traders are also awaiting labor market data this week that could shape the US Federal Reserve's (Fed) policy decision in September. Key reports include ADP Employment Change, Average Hourly Earnings, and Nonfarm Payrolls for August.
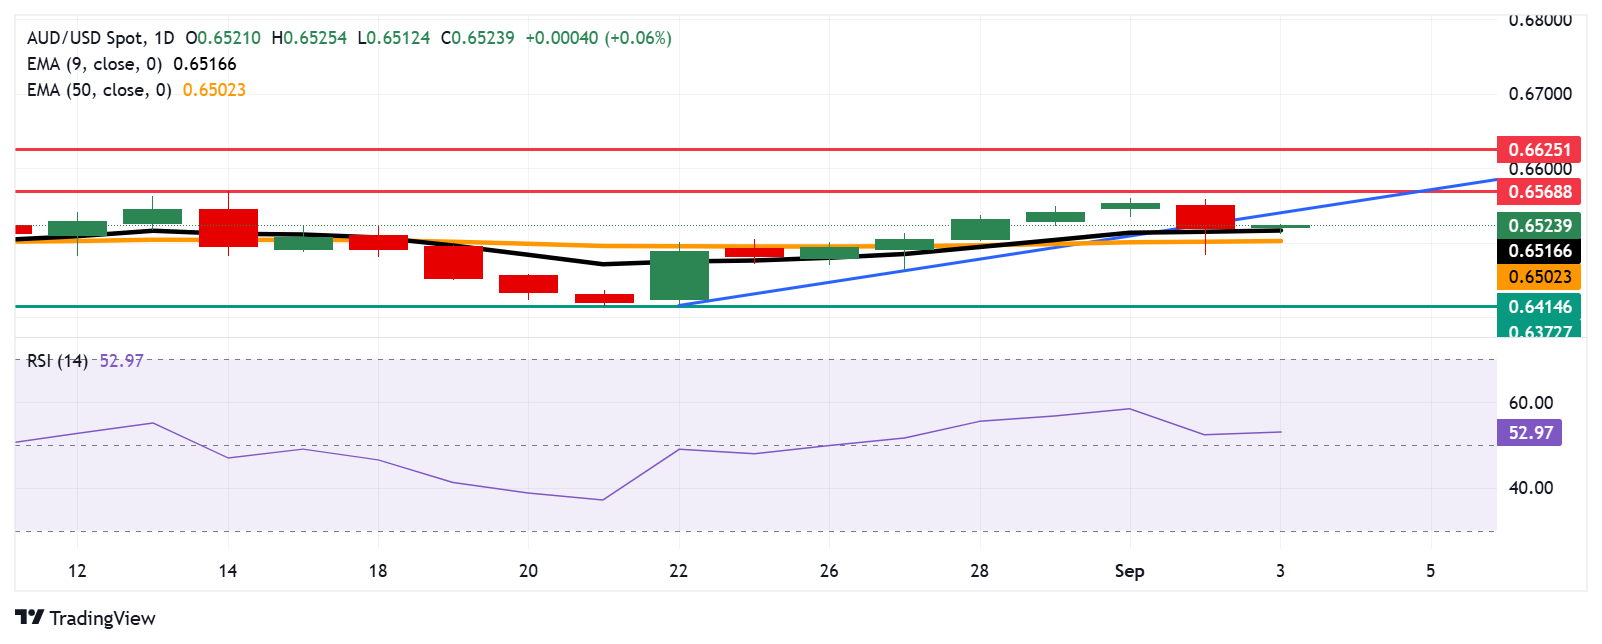
The AUD/USD pair is trading around 0.6520 on Wednesday. The technical analysis of the daily chart shows the pair has broken below the ascending trendline, suggesting a potential for a momentum shift to bearish from bullish. However, the pair is still positioned above the nine-day Exponential Moving Average (EMA), indicating short-term price momentum is stronger. A break below this level would indicate the bearish confirmation.
The primary support lies at the nine-day EMA of 0.6516, followed by the 50-day EMA at 0.6502. A break below this crucial support zone would cause the emergence of a bearish bias and prompt the AUD/USD pair to test its three-month low of 0.6414, recorded on August 21.
On the upside, the AUD/USD pair could rebound above the ascending trendline around 0.6540 and support the pair to test the five-week high of 0.6568, reached on August 14, followed by the nine-month high of 0.6625, which was recorded on July 24.
The table below shows the percentage change of Australian Dollar (AUD) against listed major currencies today. Australian Dollar was the strongest against the Japanese Yen.
| USD | EUR | GBP | JPY | CAD | AUD | NZD | CHF | |
|---|---|---|---|---|---|---|---|---|
| USD | 0.09% | 0.17% | 0.36% | 0.05% | -0.05% | 0.14% | 0.13% | |
| EUR | -0.09% | 0.09% | 0.28% | -0.03% | -0.27% | 0.04% | 0.04% | |
| GBP | -0.17% | -0.09% | 0.16% | -0.12% | -0.35% | -0.04% | -0.05% | |
| JPY | -0.36% | -0.28% | -0.16% | -0.31% | -0.49% | -0.30% | -0.21% | |
| CAD | -0.05% | 0.03% | 0.12% | 0.31% | -0.18% | 0.08% | 0.08% | |
| AUD | 0.05% | 0.27% | 0.35% | 0.49% | 0.18% | 0.14% | 0.30% | |
| NZD | -0.14% | -0.04% | 0.04% | 0.30% | -0.08% | -0.14% | -0.01% | |
| CHF | -0.13% | -0.04% | 0.05% | 0.21% | -0.08% | -0.30% | 0.00% |
The heat map shows percentage changes of major currencies against each other. The base currency is picked from the left column, while the quote currency is picked from the top row. For example, if you pick the Australian Dollar from the left column and move along the horizontal line to the US Dollar, the percentage change displayed in the box will represent AUD (base)/USD (quote).
The Caixin Services Purchasing Managers Index (PMI), released on a monthly basis by Caixin Insight Group and S&P Global, is a leading indicator gauging business activity in China's services sector. The data is derived from surveys of senior executives at both private-sector and state-owned companies. Survey responses reflect the change, if any, in the current month compared to the previous month and can anticipate changing trends in official data series such as Gross Domestic Product (GDP), industrial production, employment and inflation. The index varies between 0 and 100, with levels of 50.0 signaling no change over the previous month. A reading above 50 indicates that the services economy is generally expanding, a bullish sign for the Renminbi (CNY). Meanwhile, a reading below 50 signals that activity among service providers is generally declining, which is seen as bearish for CNY.
Read more.Last release: Wed Sep 03, 2025 01:45
Frequency: Monthly
Actual: 53
Consensus: 52.5
Previous: 52.6
Source: IHS Markit
![]()
Created
: 2025.09.03
![]()
Last updated
: 2025.09.03

FXStreet is a forex information website, delivering market analysis and news articles 24/7.
It features a number of articles contributed by well-known analysts, in addition to the ones by its editorial team.
Founded in 2000 by Francesc Riverola, a Spanish economist, it has grown to become a world-renowned information website.
We hope you find this article useful. Any comments or suggestions will be greatly appreciated.
We are also looking for writers with extensive experience in forex and crypto to join us.
please contact us at [email protected].
Disclaimer:![]()
All information and content provided on this website is provided for informational purposes only and is not intended to solicit any investment. Although all efforts are made in order to ensure that the information is correct, no guarantee is provided for the accuracy of any content on this website. Any decision made shall be the responsibility of the investor and Myforex does not take any responsibility whatsoever regarding the use of any information provided herein.
The content provided on this website belongs to Myforex and, where stated, the relevant licensors. All rights are reserved by Myforex and the relevant licensors, and no content of this website, whether in full or in part, shall be copied or displayed elsewhere without the explicit written permission of the relevant copyright holder. If you wish to use any part of the content provided on this website, please ensure that you contact Myforex.
Myforex uses cookies to improve the convenience and functionality of this website. This website may include cookies not only by us but also by third parties (advertisers, log analysts, etc.) for the purpose of tracking the activities of users. Cookie policy
