Created
: 2025.08.05


![]() 2025.08.05 13:24
2025.08.05 13:24
Gold price (XAU/USD) struggles to capitalize on a modest Asian session uptick and currently trades just below a nearly two-week high touched the previous day. Friday's weaker-than-expected US Nonfarm Payrolls (NFP) pointed to a cooling labor market and fueled speculations that the Federal Reserve (Fed) will resume its rate-cutting cycle in September. This keeps the US Treasury bond yields depressed and turns out to be a key factor lending support to the non-yielding yellow metal.
Meanwhile, US President Donald Trump signed an executive order last week imposing tariffs on several trading partners that go into effect on August 7. Adding to this, the uncertainty over the fate of China's trade relations with the US further benefits the safe-haven Gold price. However, the emergence of some US Dollar (USD) buying acts as a headwind for the precious metal. Moreover, the upbeat market mood contributes to keeping a lid on the commodity and warrants caution for bulls.
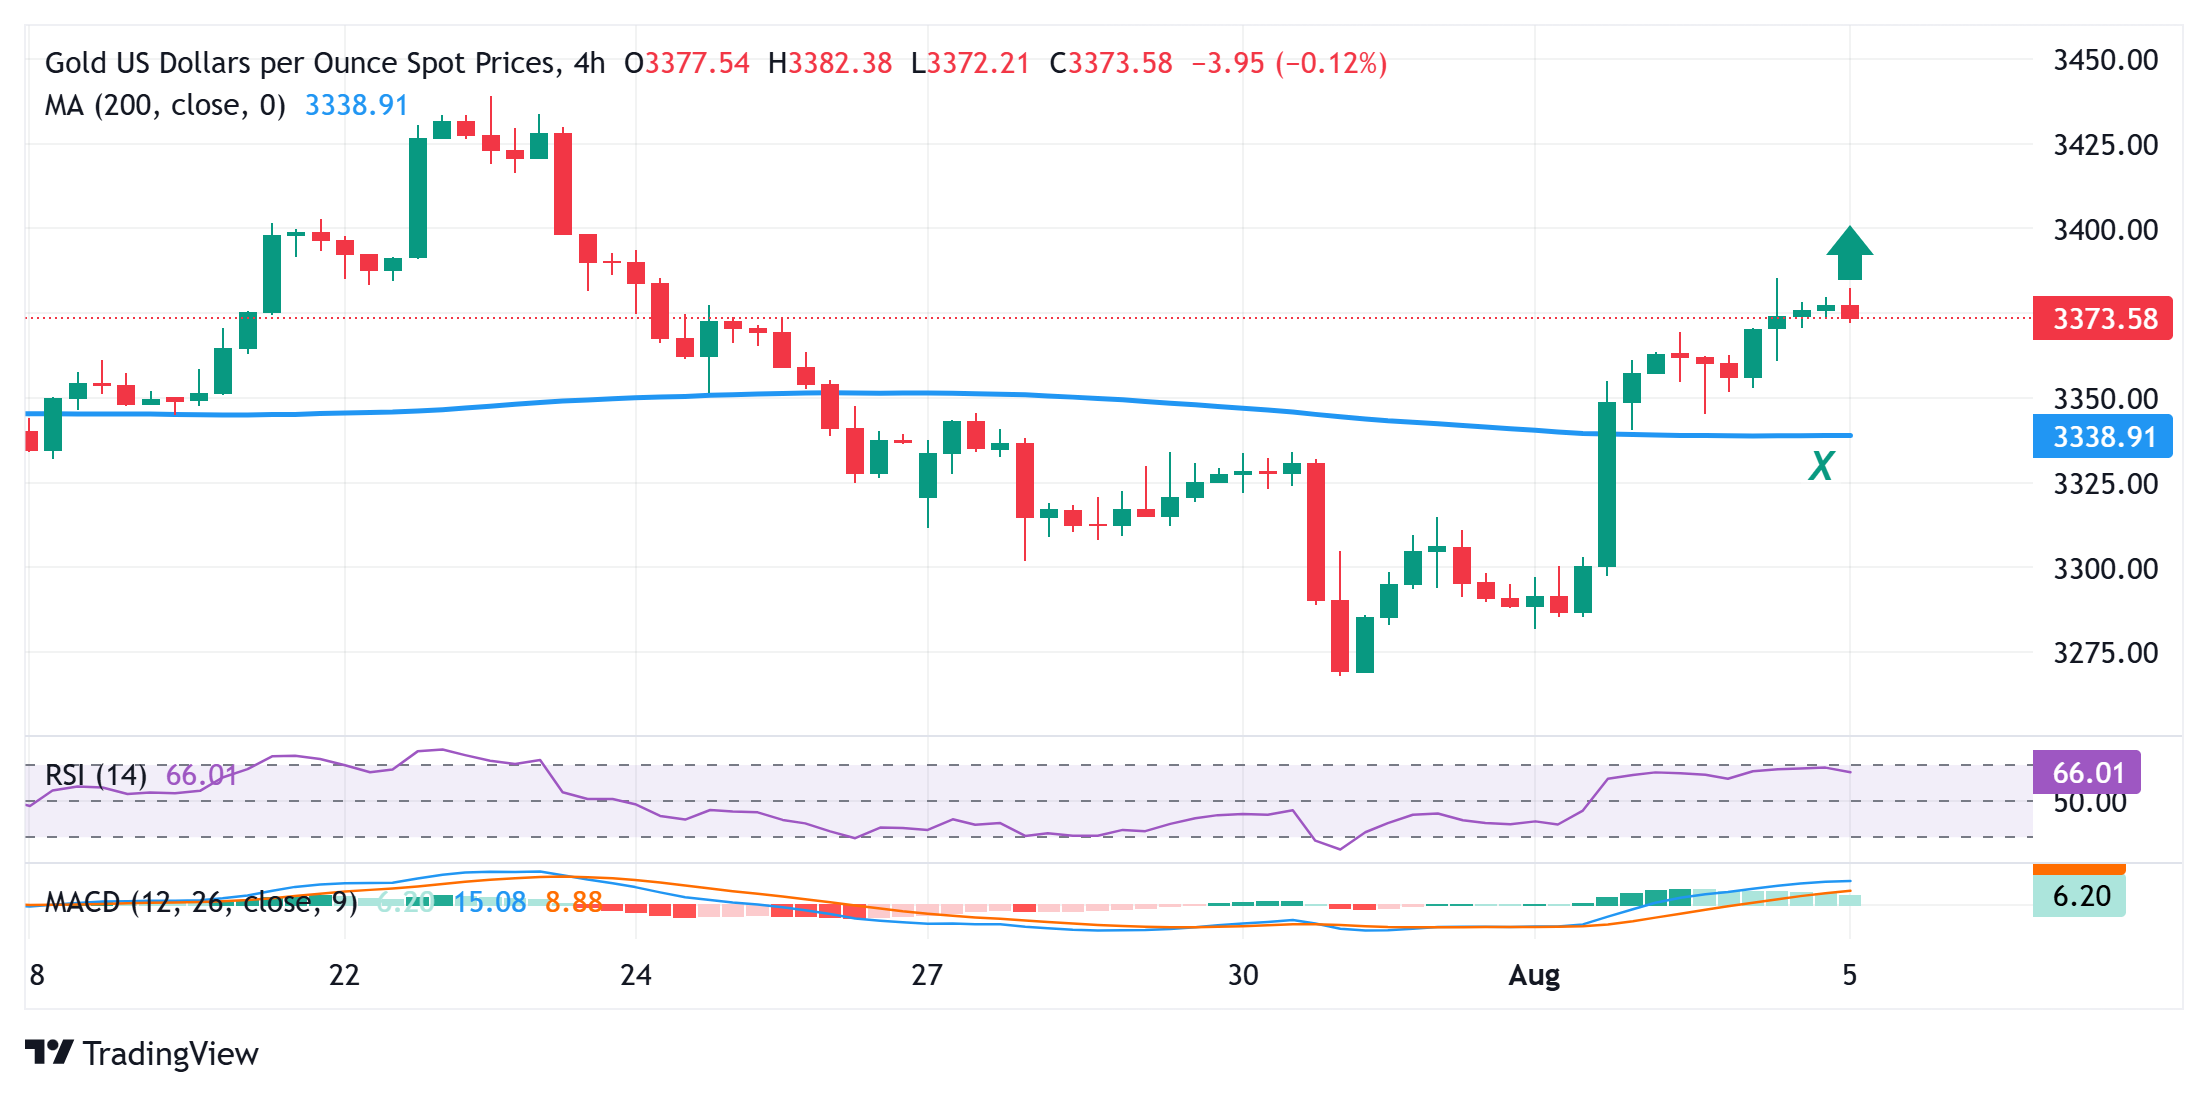
From a technical perspective, Friday's breakout through the $3,335 horizontal barrier and a subsequent strength beyond the 100-period Simple Moving Average (SMA) on the 4-hour chart favors the XAU/USD bulls. Moreover, oscillators on daily/4-hour charts have been gaining positive traction and back the case for an extension of a multi-day-old uptrend. Hence, any further slide below the $3,366-3,365 immediate support could be seen as a buying opportunity and remain limited near the $3,350-3,349 region. The latter represents the 200-period SMA on the 4-hour chart and should act as a key pivotal point, which, if broken, could make the Gold price vulnerable to accelerate the fall towards the $3,325-3,322 intermediate support en route to the $3,300 mark.
On the flip side, the overnight swing high, around the $3,385 region, now seems to act as an immediate hurdle ahead of the $3,400 round figure. Some follow-through buying should allow the Gold price to climb further towards the next relevant hurdle around the $3,434-3,435 area. The positive momentum could extend further and eventually lift the XAU/USD towards the all-time peak, around the $3,500 psychological mark touched in April.
The table below shows the percentage change of US Dollar (USD) against listed major currencies today. US Dollar was the strongest against the New Zealand Dollar.
| USD | EUR | GBP | JPY | CAD | AUD | NZD | CHF | |
|---|---|---|---|---|---|---|---|---|
| USD | 0.14% | 0.05% | 0.06% | 0.10% | 0.26% | 0.34% | 0.27% | |
| EUR | -0.14% | -0.09% | -0.07% | -0.03% | 0.04% | 0.13% | 0.13% | |
| GBP | -0.05% | 0.09% | -0.02% | 0.05% | 0.13% | 0.22% | 0.10% | |
| JPY | -0.06% | 0.07% | 0.02% | 0.04% | 0.28% | 0.26% | 0.20% | |
| CAD | -0.10% | 0.03% | -0.05% | -0.04% | 0.11% | 0.16% | 0.04% | |
| AUD | -0.26% | -0.04% | -0.13% | -0.28% | -0.11% | 0.13% | -0.03% | |
| NZD | -0.34% | -0.13% | -0.22% | -0.26% | -0.16% | -0.13% | -0.05% | |
| CHF | -0.27% | -0.13% | -0.10% | -0.20% | -0.04% | 0.03% | 0.05% |
The heat map shows percentage changes of major currencies against each other. The base currency is picked from the left column, while the quote currency is picked from the top row. For example, if you pick the US Dollar from the left column and move along the horizontal line to the Japanese Yen, the percentage change displayed in the box will represent USD (base)/JPY (quote).
![]()
Created
: 2025.08.05
![]()
Last updated
: 2025.08.05

FXStreet is a forex information website, delivering market analysis and news articles 24/7.
It features a number of articles contributed by well-known analysts, in addition to the ones by its editorial team.
Founded in 2000 by Francesc Riverola, a Spanish economist, it has grown to become a world-renowned information website.
We hope you find this article useful. Any comments or suggestions will be greatly appreciated.
We are also looking for writers with extensive experience in forex and crypto to join us.
please contact us at [email protected].
Disclaimer:![]()
All information and content provided on this website is provided for informational purposes only and is not intended to solicit any investment. Although all efforts are made in order to ensure that the information is correct, no guarantee is provided for the accuracy of any content on this website. Any decision made shall be the responsibility of the investor and Myforex does not take any responsibility whatsoever regarding the use of any information provided herein.
The content provided on this website belongs to Myforex and, where stated, the relevant licensors. All rights are reserved by Myforex and the relevant licensors, and no content of this website, whether in full or in part, shall be copied or displayed elsewhere without the explicit written permission of the relevant copyright holder. If you wish to use any part of the content provided on this website, please ensure that you contact Myforex.
Myforex uses cookies to improve the convenience and functionality of this website. This website may include cookies not only by us but also by third parties (advertisers, log analysts, etc.) for the purpose of tracking the activities of users. Cookie policy
