Created
: 2025.08.05


![]() 2025.08.05 11:12
2025.08.05 11:12
The Australian Dollar (AUD) loses ground for the second successive day despite the release of improved S&P Purchasing Managers' Index (PMI) data on Tuesday. The AUD/USD pair depreciates as the US Dollar (USD) remains steady, driven by the latest global trade developments and shifting expectations for monetary policy.
The S&P Global Australia Composite PMI climbed to 53.8 in July from 51.6 in June, signaling a tenth consecutive monthly rise in business activity and the strongest expansion in private sector activity since April 2022. Meanwhile, Services PMI Business Activity Index rose to 54.1 in July from 51.8 in June, marking the highest level since March 2024.
China's Caixin Services Purchasing Managers' Index unexpectedly jumped to 52.6 in July from 50.6 in June. The market forecast was for a 50.2 print in the reported period.
The Reserve Bank of Australia (RBA) is expected to deliver a 25 basis point rate cut next week, which would bring the cash rate down to 3.60%. The case for easing has grown stronger as core inflation slowed to 2.7% in June, well within the RBA's 2-3% target, along with rising unemployment and slowing wage growth.
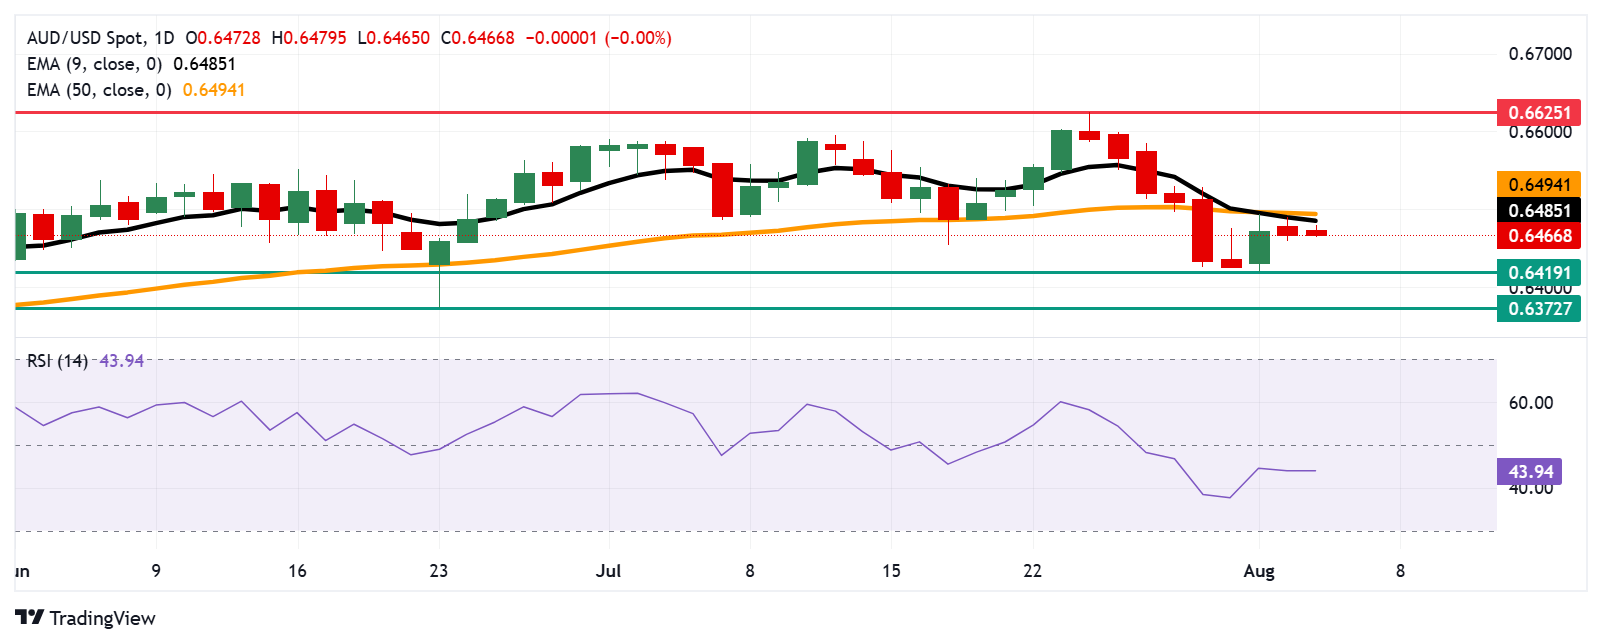
The AUD/USD pair is trading around 0.6470 on Tuesday. Technical analysis on the daily chart suggests a bearish bias, with the 14-day Relative Strength Index (RSI) holding below the 50 level. The pair is also positioned below the nine-day Exponential Moving Average (EMA), signaling weakening short-term momentum.
On the downside, the primary support appears at the two-month low of 0.6419, which was recorded on August 1. A break below this level could put downward pressure on the AUD/USD pair to test a three-month low at 0.6372, recorded on June 23.
The AUD/USD pair could approach the initial barrier at the nine-day EMA of 0.6485, aligned with the 50-day EMA of 0.6494. A break above these levels could strengthen the short- and medium-term price momentum and support the pair to explore the region around the nine-month high at 0.6625.
The table below shows the percentage change of Australian Dollar (AUD) against listed major currencies today. Australian Dollar was the weakest against the Japanese Yen.
| USD | EUR | GBP | JPY | CAD | AUD | NZD | CHF | |
|---|---|---|---|---|---|---|---|---|
| USD | 0.07% | -0.02% | -0.06% | 0.00% | 0.13% | 0.18% | 0.17% | |
| EUR | -0.07% | -0.10% | -0.12% | -0.05% | -0.02% | 0.04% | 0.10% | |
| GBP | 0.02% | 0.10% | -0.06% | 0.04% | 0.08% | 0.14% | 0.07% | |
| JPY | 0.06% | 0.12% | 0.06% | 0.07% | 0.27% | 0.22% | 0.22% | |
| CAD | -0.01% | 0.05% | -0.04% | -0.07% | 0.07% | 0.09% | 0.03% | |
| AUD | -0.13% | 0.02% | -0.08% | -0.27% | -0.07% | 0.09% | -0.00% | |
| NZD | -0.18% | -0.04% | -0.14% | -0.22% | -0.09% | -0.09% | 0.00% | |
| CHF | -0.17% | -0.10% | -0.07% | -0.22% | -0.03% | 0.00% | -0.00% |
The heat map shows percentage changes of major currencies against each other. The base currency is picked from the left column, while the quote currency is picked from the top row. For example, if you pick the Australian Dollar from the left column and move along the horizontal line to the US Dollar, the percentage change displayed in the box will represent AUD (base)/USD (quote).
The Caixin Services Purchasing Managers Index (PMI), released on a monthly basis by Caixin Insight Group and S&P Global, is a leading indicator gauging business activity in China's services sector. The data is derived from surveys of senior executives at both private-sector and state-owned companies. Survey responses reflect the change, if any, in the current month compared to the previous month and can anticipate changing trends in official data series such as Gross Domestic Product (GDP), industrial production, employment and inflation. The index varies between 0 and 100, with levels of 50.0 signaling no change over the previous month. A reading above 50 indicates that the services economy is generally expanding, a bullish sign for the Renminbi (CNY). Meanwhile, a reading below 50 signals that activity among service providers is generally declining, which is seen as bearish for CNY.
Read more.Last release: Tue Aug 05, 2025 01:45
Frequency: Monthly
Actual: 52.6
Consensus: 50.2
Previous: 50.6
Source: IHS Markit
![]()
Created
: 2025.08.05
![]()
Last updated
: 2025.08.05

FXStreet is a forex information website, delivering market analysis and news articles 24/7.
It features a number of articles contributed by well-known analysts, in addition to the ones by its editorial team.
Founded in 2000 by Francesc Riverola, a Spanish economist, it has grown to become a world-renowned information website.
We hope you find this article useful. Any comments or suggestions will be greatly appreciated.
We are also looking for writers with extensive experience in forex and crypto to join us.
please contact us at [email protected].
Disclaimer:![]()
All information and content provided on this website is provided for informational purposes only and is not intended to solicit any investment. Although all efforts are made in order to ensure that the information is correct, no guarantee is provided for the accuracy of any content on this website. Any decision made shall be the responsibility of the investor and Myforex does not take any responsibility whatsoever regarding the use of any information provided herein.
The content provided on this website belongs to Myforex and, where stated, the relevant licensors. All rights are reserved by Myforex and the relevant licensors, and no content of this website, whether in full or in part, shall be copied or displayed elsewhere without the explicit written permission of the relevant copyright holder. If you wish to use any part of the content provided on this website, please ensure that you contact Myforex.
Myforex uses cookies to improve the convenience and functionality of this website. This website may include cookies not only by us but also by third parties (advertisers, log analysts, etc.) for the purpose of tracking the activities of users. Cookie policy
