Created
: 2025.08.04


![]() 2025.08.04 11:49
2025.08.04 11:49
The Australian Dollar (AUD) advances against the US Dollar (USD) on Monday, extending its gains for the second successive trading day. The AUD/USD pair gained ground following the release of Australia's inflation gauge data.
TD-MI Inflation Gauge rose 0.9% month-over-month in July, following June's modest 0.1% rise and marking the sharpest rise since December 2023. Meanwhile, the annual inflation gauge remained consistent at a 2.4% increase. The monthly increase adds to the Reserve Bank of Australia's (RBA) concerns amid continued uncertainty in supply chains and consumer demand.
The AUD also received support as Australia was spared from the latest United States (US) tariff hikes, indicating that President Donald Trump had left the 10% baseline tariffs on Australian goods unchanged. Moreover, a weaker United States (US) jobs report prompted market reaction to price in two interest rate cuts by the Federal Reserve (Fed).
The US and China were unable to reach an agreement on extending the 90-day tariff pause during their latest round of talks in Stockholm, Sweden. The current pause is set to expire on August 12, with the final decision resting in the hands of US President Donald Trump. In the meantime, US tariffs have been lowered from 145% to 30%, while Chinese tariffs have been reduced from 125% to 10%.
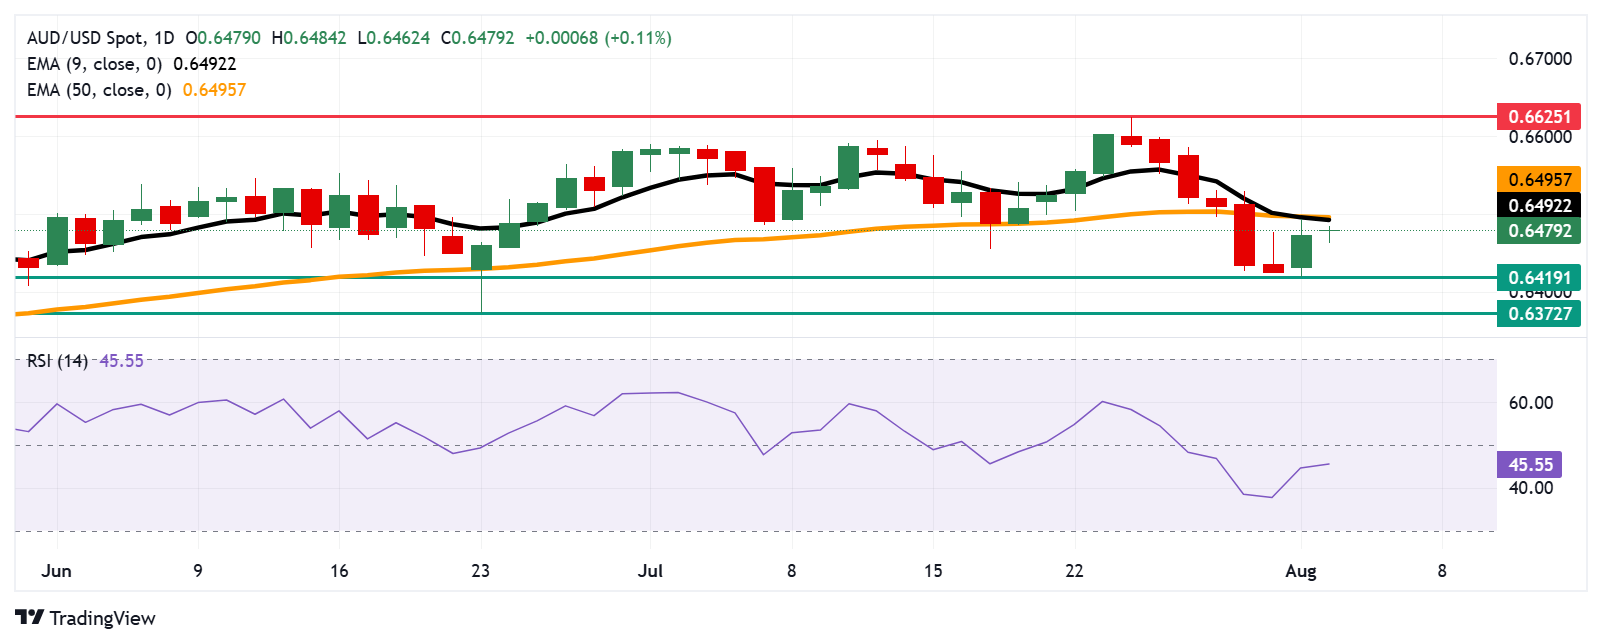
The AUD/USD pair is trading around 0.6480 on Monday. Technical analysis on the daily chart suggests a bearish bias, with the 14-day Relative Strength Index (RSI) holding below the 50 level. The pair is also positioned below the nine-day Exponential Moving Average (EMA), signaling weakening short-term momentum.
On the downside, the AUD/USD pair could find the primary support at the two-month low of 0.6419, which was recorded on August 1. A break below this level could put downward pressure on the pair to test a three-month low at 0.6372, recorded on June 23.
The AUD/USD pair may target the initial barrier at the nine-day EMA of 0.6492, aligned with the 50-day EMA of 0.6495. A break above these levels could strengthen the short- and medium-term price momentum and support the pair to explore the region around the nine-month high at 0.6625.
The table below shows the percentage change of Australian Dollar (AUD) against listed major currencies today. Australian Dollar was the strongest against the Japanese Yen.
| USD | EUR | GBP | JPY | CAD | AUD | NZD | CHF | |
|---|---|---|---|---|---|---|---|---|
| USD | 0.15% | 0.02% | 0.33% | -0.04% | 0.01% | -0.09% | -0.03% | |
| EUR | -0.15% | -0.07% | 0.19% | -0.17% | -0.27% | -0.24% | -0.19% | |
| GBP | -0.02% | 0.07% | 0.27% | -0.10% | -0.19% | -0.17% | -0.12% | |
| JPY | -0.33% | -0.19% | -0.27% | -0.35% | -0.46% | -0.42% | -0.19% | |
| CAD | 0.04% | 0.17% | 0.10% | 0.35% | -0.11% | -0.06% | -0.02% | |
| AUD | -0.01% | 0.27% | 0.19% | 0.46% | 0.11% | 0.02% | 0.08% | |
| NZD | 0.09% | 0.24% | 0.17% | 0.42% | 0.06% | -0.02% | 0.04% | |
| CHF | 0.03% | 0.19% | 0.12% | 0.19% | 0.02% | -0.08% | -0.04% |
The heat map shows percentage changes of major currencies against each other. The base currency is picked from the left column, while the quote currency is picked from the top row. For example, if you pick the Australian Dollar from the left column and move along the horizontal line to the US Dollar, the percentage change displayed in the box will represent AUD (base)/USD (quote).
The TD-MI inflation gauge, released by Melbourne Institute, is designed to provide a timely and accurate monthly measure of inflation in Australia. Based on the Australian Bureau of Statistics methodology for calculating the quarterly consumer price index, the Melbourne Institute Monthly Inflation Gauge estimates month-to-month price movements for a wide-ranging basket of goods and services across the main capital cities of Australia. The MoM figure compares the prices of goods in the reference month to the previous month. The higher the inflation, the stronger the effect it will have on the probability of an interest-rate hike by the RBA. Generally speaking, a high reading should be taken as positive, or bullish, for the AUD, while a low reading is seen as negative or bearish.
Read more.Last release: Mon Aug 04, 2025 01:00
Frequency: Monthly
Actual: 0.9%
Consensus: -
Previous: 0.1%
Source: Melbourne Institute
![]()
Created
: 2025.08.04
![]()
Last updated
: 2025.08.04

FXStreet is a forex information website, delivering market analysis and news articles 24/7.
It features a number of articles contributed by well-known analysts, in addition to the ones by its editorial team.
Founded in 2000 by Francesc Riverola, a Spanish economist, it has grown to become a world-renowned information website.
We hope you find this article useful. Any comments or suggestions will be greatly appreciated.
We are also looking for writers with extensive experience in forex and crypto to join us.
please contact us at [email protected].
Disclaimer:![]()
All information and content provided on this website is provided for informational purposes only and is not intended to solicit any investment. Although all efforts are made in order to ensure that the information is correct, no guarantee is provided for the accuracy of any content on this website. Any decision made shall be the responsibility of the investor and Myforex does not take any responsibility whatsoever regarding the use of any information provided herein.
The content provided on this website belongs to Myforex and, where stated, the relevant licensors. All rights are reserved by Myforex and the relevant licensors, and no content of this website, whether in full or in part, shall be copied or displayed elsewhere without the explicit written permission of the relevant copyright holder. If you wish to use any part of the content provided on this website, please ensure that you contact Myforex.
Myforex uses cookies to improve the convenience and functionality of this website. This website may include cookies not only by us but also by third parties (advertisers, log analysts, etc.) for the purpose of tracking the activities of users. Cookie policy
