Created
: 2025.08.02


![]() 2025.08.02 01:33
2025.08.02 01:33
Silver (XAG/USD) reverses early losses on Friday and climbs back above the $36.50 mark, buoyed by a broad-based sell-off in the US Dollar (USD) after the latest Nonfarm Payrolls (NFP) report surprised to the downside.
The July Nonfarm Payrolls (NFP) report delivered a significant downside surprise. The US Bureau of Labor Statistics reported that the US economy added just 73,000 jobs, well below the 110,000 expected. Adding to the dovish tone, June's payrolls were revised sharply lower to 14,000 from a previously reported 147,000. The Unemployment Rate ticked higher to 4.2%, in line with forecasts, while wage growth remained steady, with Average Hourly Earnings rising 0.3% MoM and 3.9% YoY. The Unemployment Rate ticked up to 4.2% in July, matching expectations and rising slightly from 4.1% in June.
In the manufacturing sector, the S&P Global Manufacturing PMI (Final) rose slightly to 49.8 in July, beating expectations of 49.7 and improving from 49.5 previously. However, the more closely watched ISM Manufacturing PMI fell short of forecasts, dropping to 48.0 from 49.0, signaling ongoing contraction in factory activity.
The softer-than-expected US jobs data triggered a sharp decline in US Treasury yields and reignited speculation that the Federal Reserve (Fed) could begin cutting interest rates as early as September. This shift in sentiment weighed heavily on the Greenback, boosting demand for non-yielding assets like Silver. According to the CME Fed watch tool, markets are now pricing in an 82% probability of a rate cut at the Fed's September meeting -- a steep surge from just 37% prior to the release -- as traders reassess the central bank's policy path in light of the cooling labor market.
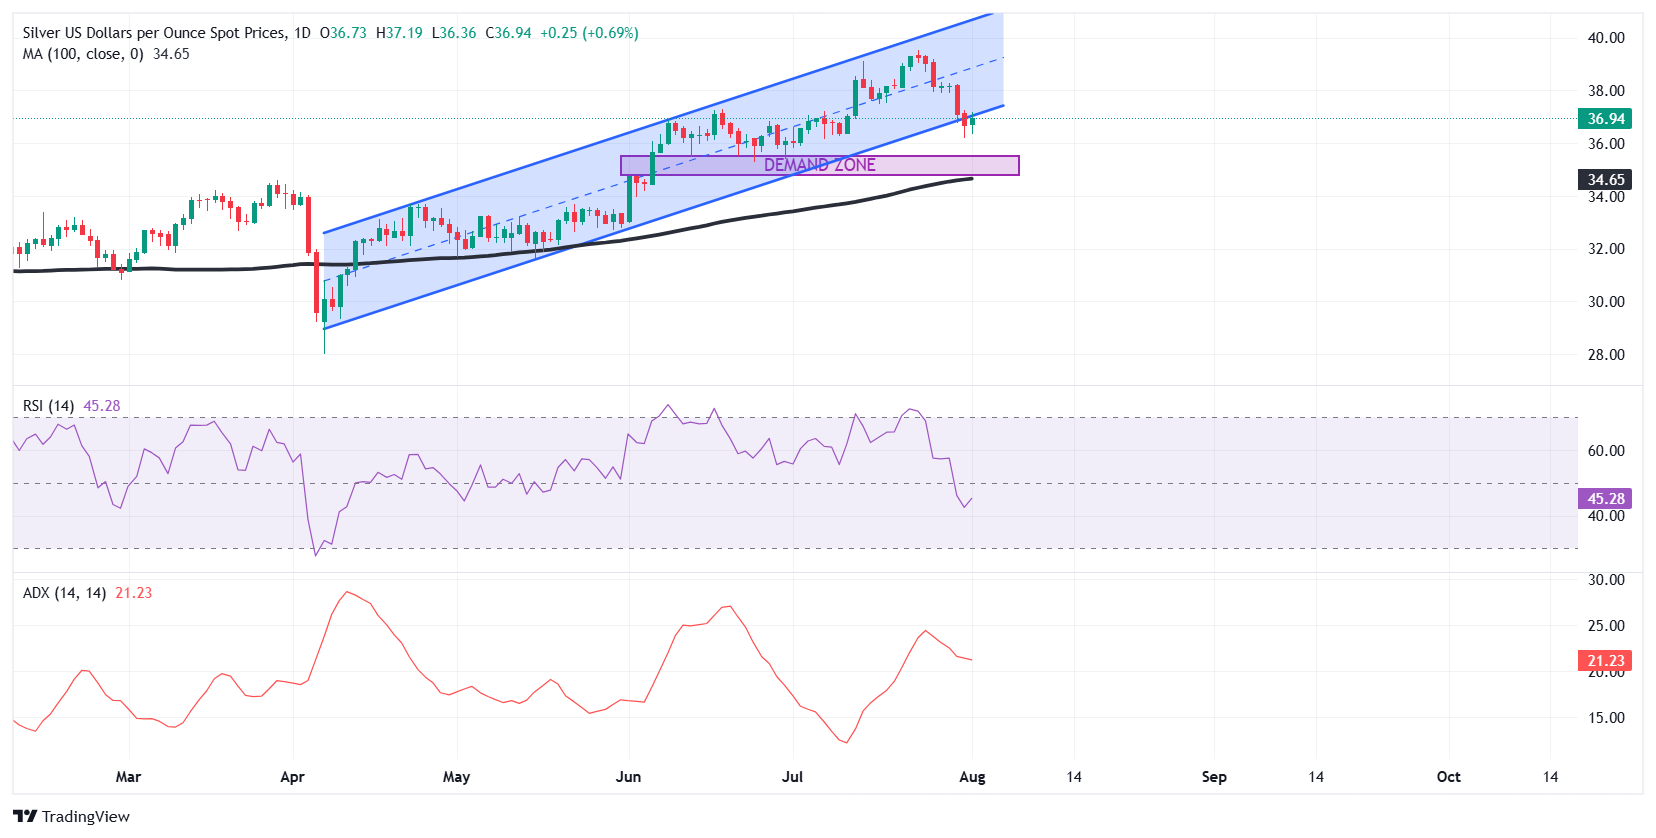
From a technical standpoint, the intraday rebound in Silver offers some short-term relief for bulls, but the broader setup still calls for caution. On the daily chart, XAG/USD remains below the ascending channel it broke on Thursday, with no clear follow-through to the downside. Until the metal reclaims the broken channel or confirms a deeper breakdown, the outlook remains neutral to bearish.
The metal bounced off the 50-day Exponential Moving Average (EMA) at $36.56, which acts as immediate support. A daily close below this zone could expose the next key downside target at the 100-day Simple Moving Average (SMA), located around $34.65.
The Relative Strength Index (RSI) on the daily chart has turned slightly higher and now reads 45, reflecting a modest improvement in momentum. However, it remains below the neutral 50 mark, suggesting that bearish sentiment still prevails. Meanwhile, the Average Directional Index (ADX) is at 21.23, indicating a weak trend and the potential for consolidation in the near term. If the recovery holds, bulls may aim for the $37.50-$38.00 resistance zone. On the downside, a daily close back below $36.00 could revive selling pressure and expose a crucial demand zone in the $35.30-$35.70 range, which could provide some respite for bulls.
Silver is a precious metal highly traded among investors. It has been historically used as a store of value and a medium of exchange. Although less popular than Gold, traders may turn to Silver to diversify their investment portfolio, for its intrinsic value or as a potential hedge during high-inflation periods. Investors can buy physical Silver, in coins or in bars, or trade it through vehicles such as Exchange Traded Funds, which track its price on international markets.
Silver prices can move due to a wide range of factors. Geopolitical instability or fears of a deep recession can make Silver price escalate due to its safe-haven status, although to a lesser extent than Gold's. As a yieldless asset, Silver tends to rise with lower interest rates. Its moves also depend on how the US Dollar (USD) behaves as the asset is priced in dollars (XAG/USD). A strong Dollar tends to keep the price of Silver at bay, whereas a weaker Dollar is likely to propel prices up. Other factors such as investment demand, mining supply - Silver is much more abundant than Gold - and recycling rates can also affect prices.
Silver is widely used in industry, particularly in sectors such as electronics or solar energy, as it has one of the highest electric conductivity of all metals - more than Copper and Gold. A surge in demand can increase prices, while a decline tends to lower them. Dynamics in the US, Chinese and Indian economies can also contribute to price swings: for the US and particularly China, their big industrial sectors use Silver in various processes; in India, consumers' demand for the precious metal for jewellery also plays a key role in setting prices.
Silver prices tend to follow Gold's moves. When Gold prices rise, Silver typically follows suit, as their status as safe-haven assets is similar. The Gold/Silver ratio, which shows the number of ounces of Silver needed to equal the value of one ounce of Gold, may help to determine the relative valuation between both metals. Some investors may consider a high ratio as an indicator that Silver is undervalued, or Gold is overvalued. On the contrary, a low ratio might suggest that Gold is undervalued relative to Silver.
![]()
Created
: 2025.08.02
![]()
Last updated
: 2025.08.02

FXStreet is a forex information website, delivering market analysis and news articles 24/7.
It features a number of articles contributed by well-known analysts, in addition to the ones by its editorial team.
Founded in 2000 by Francesc Riverola, a Spanish economist, it has grown to become a world-renowned information website.
We hope you find this article useful. Any comments or suggestions will be greatly appreciated.
We are also looking for writers with extensive experience in forex and crypto to join us.
please contact us at [email protected].
Disclaimer:![]()
All information and content provided on this website is provided for informational purposes only and is not intended to solicit any investment. Although all efforts are made in order to ensure that the information is correct, no guarantee is provided for the accuracy of any content on this website. Any decision made shall be the responsibility of the investor and Myforex does not take any responsibility whatsoever regarding the use of any information provided herein.
The content provided on this website belongs to Myforex and, where stated, the relevant licensors. All rights are reserved by Myforex and the relevant licensors, and no content of this website, whether in full or in part, shall be copied or displayed elsewhere without the explicit written permission of the relevant copyright holder. If you wish to use any part of the content provided on this website, please ensure that you contact Myforex.
Myforex uses cookies to improve the convenience and functionality of this website. This website may include cookies not only by us but also by third parties (advertisers, log analysts, etc.) for the purpose of tracking the activities of users. Cookie policy
