Created
: 2025.07.25


![]() 2025.07.25 13:00
2025.07.25 13:00
Gold price (XAU/USD) struggles to capitalize on the overnight bounce from the vicinity of mid-$3,300s and trades with a mild negative bias during the Asian session on Friday. The US Dollar (USD) attracts some follow-through buyers and moves further away from a multi-week low touched on Thursday, which, in turn, is seen as a key factor weighing on the commodity. Adding to this, the latest trade optimism fueled by the US-Japan deal undermines demand for the safe-haven precious metal and contributes to the weaker tone for the third straight day.
However, the uncertainty over the Federal Reserve's (Fed) rate-cut path and fears about the central bank's independence, amid mounting political pressure to lower borrowing costs, might hold back the USD bulls from placing aggressive bets. Moreover, a dangerous escalation of border disputes between Thailand and Cambodia could offer some support to the Gold price. Traders now look forward to the release of US Durable Goods Orders, which might influence the USD and provide some impetus to the XAU/USD pair heading into the weekend.
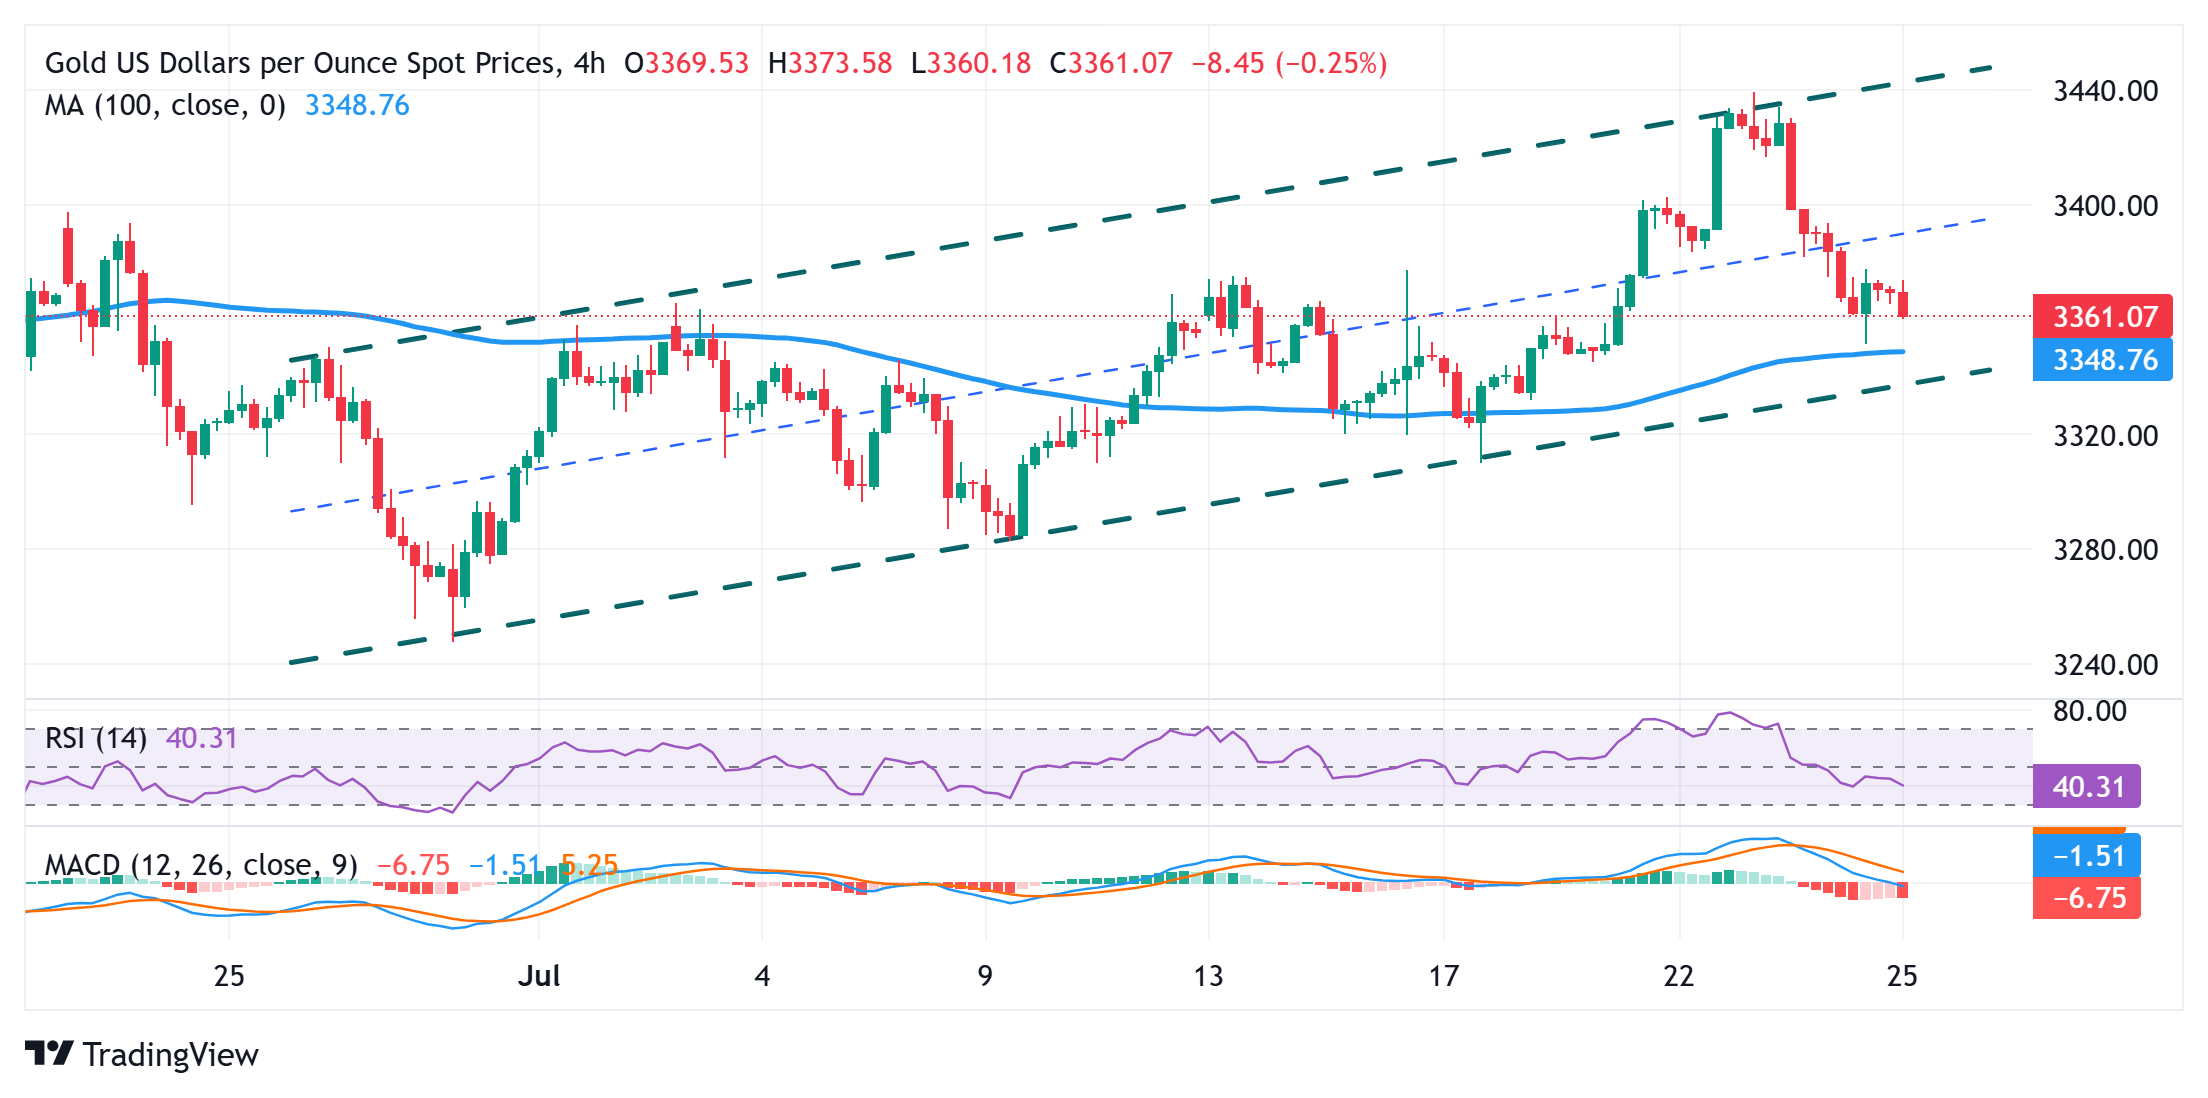
The overnight bounce from the vicinity of the 100-period Simple Moving Average (SMA) on the 4-hour chart runs out of steam near the $3,377 region. The said area should now act as an immediate strong barrier, above which a bout of short-covering could allow the Gold price to reclaim the $3,400 mark. Some follow-through buying should pave the way for a move towards the $3,438-3,440 static barrier, which coincides with the top boundary of an ascending channel held since the beginning of this month.
On the flip side, Thursday's swing low, around the $3,351 area, which nears the 100-period SMA on the 4-hour chart, might continue to protect the immediate downside for the Gold price. This is followed by the trend-channel support around the $3,335 region. A convincing break below the latter might shift the near-term bias in favor of the XAU/USD bears and expose last week's swing low, around the $3,309 area. The commodity could weaken further below the $3,300 mark and retest the monthly trough, around the $3,283-3,282 zone.
The table below shows the percentage change of US Dollar (USD) against listed major currencies today. US Dollar was the strongest against the Australian Dollar.
| USD | EUR | GBP | JPY | CAD | AUD | NZD | CHF | |
|---|---|---|---|---|---|---|---|---|
| USD | 0.03% | 0.13% | 0.18% | 0.11% | 0.18% | 0.04% | 0.09% | |
| EUR | -0.03% | 0.13% | 0.12% | 0.10% | 0.07% | 0.00% | 0.05% | |
| GBP | -0.13% | -0.13% | 0.02% | -0.05% | -0.05% | -0.10% | -0.08% | |
| JPY | -0.18% | -0.12% | -0.02% | -0.08% | -0.06% | -0.13% | -0.10% | |
| CAD | -0.11% | -0.10% | 0.05% | 0.08% | 0.12% | -0.07% | -0.06% | |
| AUD | -0.18% | -0.07% | 0.05% | 0.06% | -0.12% | -0.06% | 0.01% | |
| NZD | -0.04% | -0.01% | 0.10% | 0.13% | 0.07% | 0.06% | 0.04% | |
| CHF | -0.09% | -0.05% | 0.08% | 0.10% | 0.06% | -0.01% | -0.04% |
The heat map shows percentage changes of major currencies against each other. The base currency is picked from the left column, while the quote currency is picked from the top row. For example, if you pick the US Dollar from the left column and move along the horizontal line to the Japanese Yen, the percentage change displayed in the box will represent USD (base)/JPY (quote).
![]()
Created
: 2025.07.25
![]()
Last updated
: 2025.07.25

FXStreet is a forex information website, delivering market analysis and news articles 24/7.
It features a number of articles contributed by well-known analysts, in addition to the ones by its editorial team.
Founded in 2000 by Francesc Riverola, a Spanish economist, it has grown to become a world-renowned information website.
We hope you find this article useful. Any comments or suggestions will be greatly appreciated.
We are also looking for writers with extensive experience in forex and crypto to join us.
please contact us at [email protected].
Disclaimer:![]()
All information and content provided on this website is provided for informational purposes only and is not intended to solicit any investment. Although all efforts are made in order to ensure that the information is correct, no guarantee is provided for the accuracy of any content on this website. Any decision made shall be the responsibility of the investor and Myforex does not take any responsibility whatsoever regarding the use of any information provided herein.
The content provided on this website belongs to Myforex and, where stated, the relevant licensors. All rights are reserved by Myforex and the relevant licensors, and no content of this website, whether in full or in part, shall be copied or displayed elsewhere without the explicit written permission of the relevant copyright holder. If you wish to use any part of the content provided on this website, please ensure that you contact Myforex.
Myforex uses cookies to improve the convenience and functionality of this website. This website may include cookies not only by us but also by third parties (advertisers, log analysts, etc.) for the purpose of tracking the activities of users. Cookie policy
