Created
: 2025.07.16


![]() 2025.07.16 01:28
2025.07.16 01:28
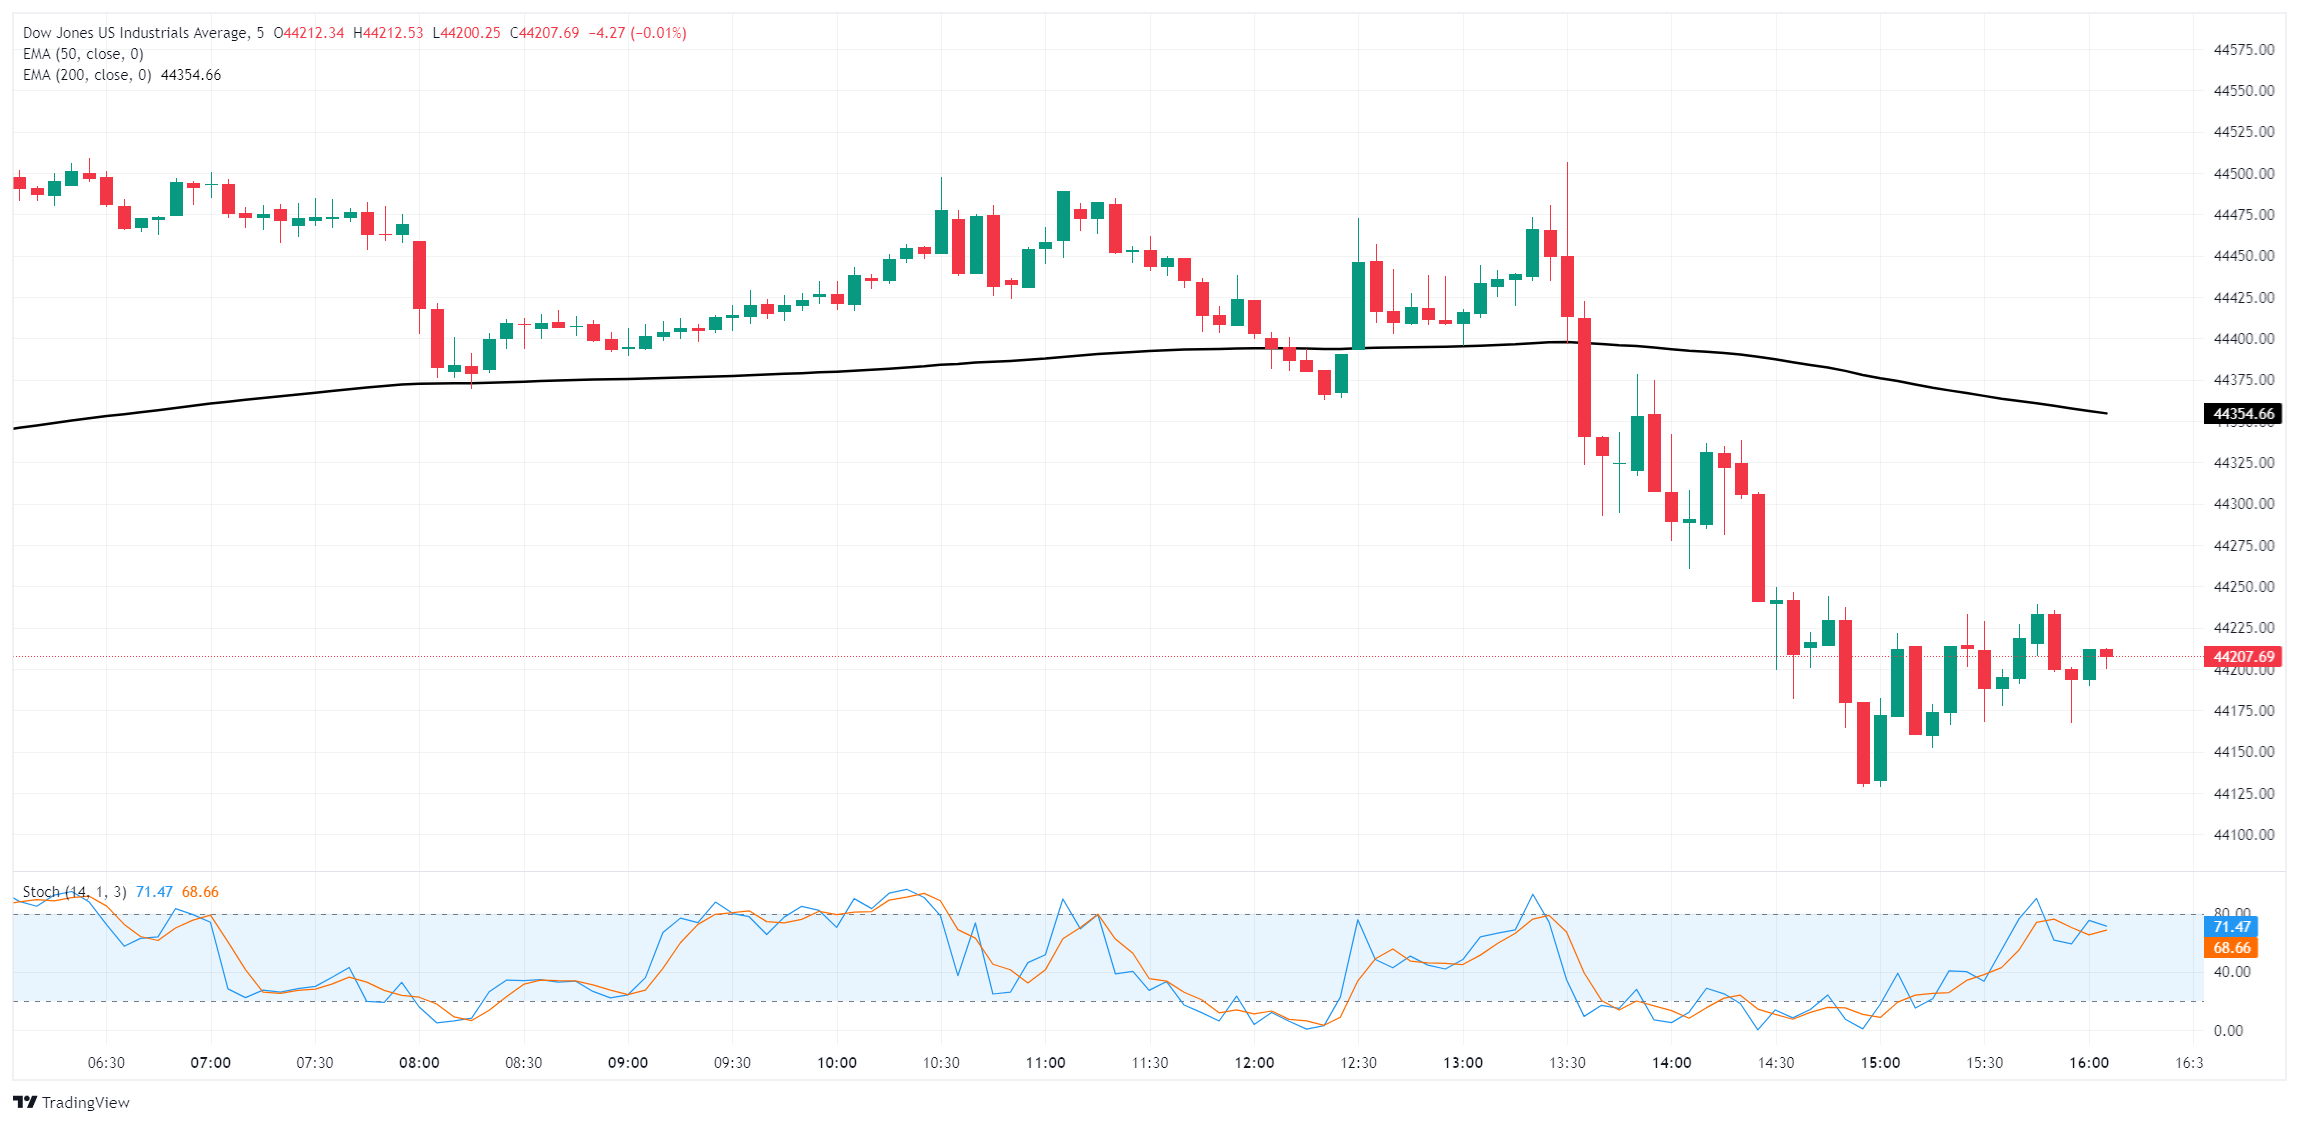
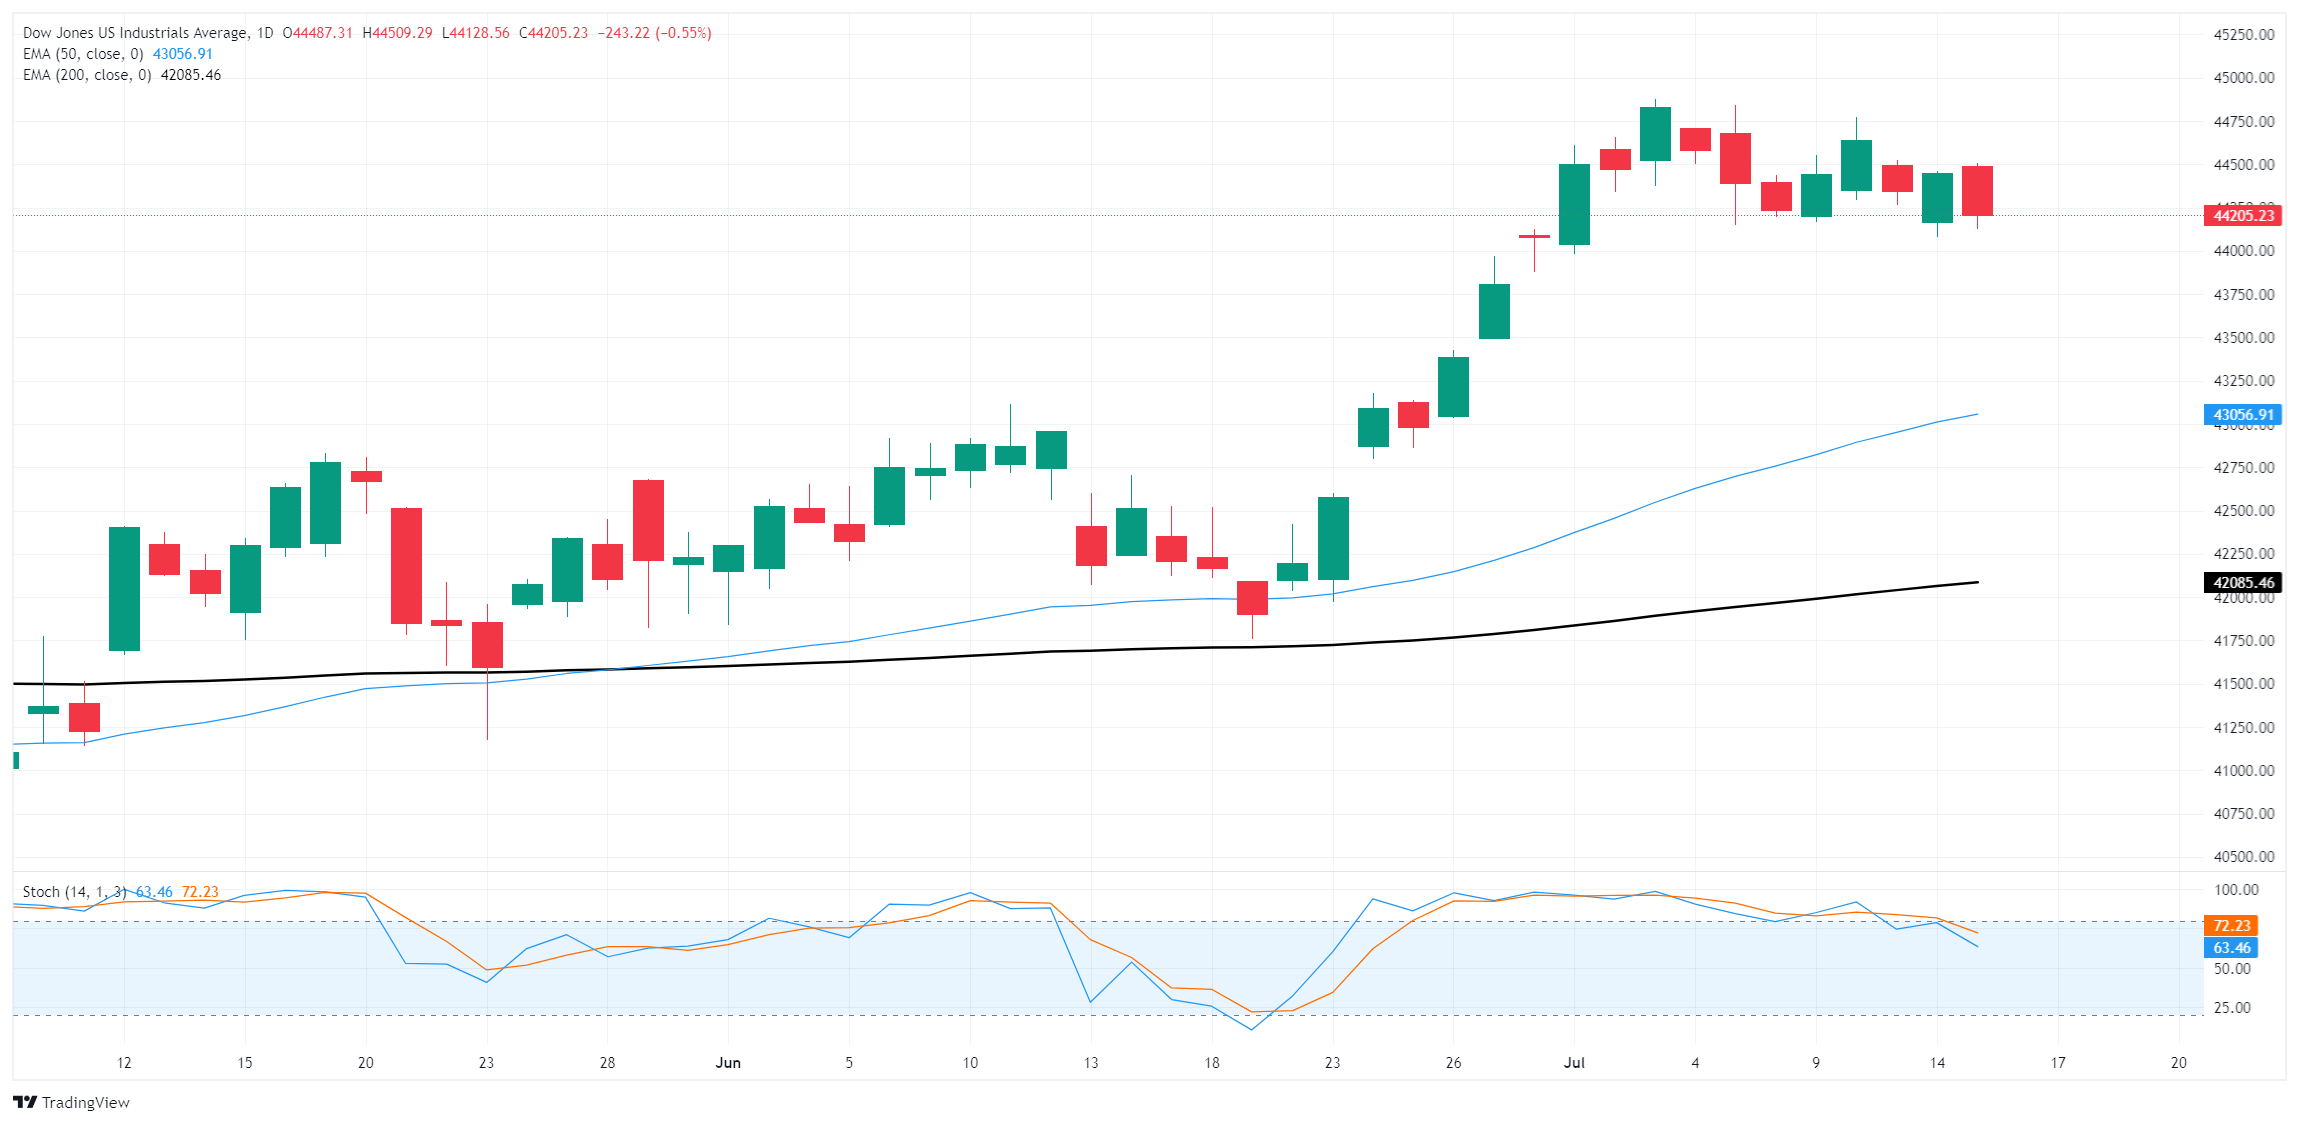
The Dow Jones Industrial Average (DJIA) fumbled on Tuesday, losing enough ground to knock the megacap index back below the previous week's close, but still holding onto near-term consolidation levels. US Consumer Price Index (CPI) inflation showed price pressures are still on the wrong side of Federal Reserve (Fed) targets, knocking investor hopes for a summer rate cut even further back.
US CPI inflation rose through the tail end of the second quarter. Despite the figures mostly keeping in line with or beating median forecasts, investors are still feeling the pressure from rising price pressures. Annualized headline CPI inflation rose to 2.7% YoY in June, moving in the opposite direction of the Fed policy target range of 2%. With inflation pressures still simmering away in the background, already-thin market hopes for an early rate cut from the Fed have evaporated.
According to the CME's FedWatch Tool, rate traders have fully priced in a rate hold at the Fed's July rate meeting. Hopes for a September rate cut also got knocked back post-CPI, with 44% odds of a continued hold on rates on the books. Rate markets are still holding out for two cuts in 2025 despite still-warm inflation measures, with 80% odds of at least a quarter-point rate cut priced in for October.
Elsewhere in the markets, tech rally fans caught an updraft after Nvidia (NVDA) CEO Jensen Huang announced that the Trump administration would grant Nvidia a reprieve from tech restrictions on China, allowing the silicon-punching megagiant to resume selling AI-focused chipsets into the Chinese market. The announcement may come with strings attached, however: the Trump team is gearing up for a large-scale announcement at the end of the month to declare their plans to ensure continued US dominance in the AI tech space. With the Trump administration's habit of whipsawing on new and old regulations, exemptions, and restrictions alike, there could easily be material changes to Nvidia's foreign market access long before exports of highly profitable hardware can resume.
Still, things are looking good for Nvidia; the chipstack manufacturer is the first company in history to reach a $4T market cap. Nvidia has climbed around 1,500% from its post-COVID low of $10.81 per share from October of 2022.
Banking stocks also stumbled on Tuesday. Q2 earnings reports overall beat expectations; however, declining income guidance knocked Wells Fargo (WFC) down around 4% on the day. JPMorgan Chase (JPM) also declined slightly despite beating headline earnings expectations, and asset management giant BlackRock (BLK) tumbled 6% after missing revenue forecasts entirely.
Tech gains notwithstanding, the Dow Jones is in the red on Tuesday, declining by over 0.85% from top to bottom and shedding nearly 400 points at its lowest, as bullish exhaustion gives way to a choppy consolidation phase, testing below 44,200 for the second time this week. Despite recent consolidation, the Dow is still holding firmly on the bullish side, albeit still below all-time highs north of 45,000 as the industry-heavy blue chip index underperforms its tech-biased siblings.
The Dow Jones Industrial Average, one of the oldest stock market indices in the world, is compiled of the 30 most traded stocks in the US. The index is price-weighted rather than weighted by capitalization. It is calculated by summing the prices of the constituent stocks and dividing them by a factor, currently 0.152. The index was founded by Charles Dow, who also founded the Wall Street Journal. In later years it has been criticized for not being broadly representative enough because it only tracks 30 conglomerates, unlike broader indices such as the S&P 500.
Many different factors drive the Dow Jones Industrial Average (DJIA). The aggregate performance of the component companies revealed in quarterly company earnings reports is the main one. US and global macroeconomic data also contributes as it impacts on investor sentiment. The level of interest rates, set by the Federal Reserve (Fed), also influences the DJIA as it affects the cost of credit, on which many corporations are heavily reliant. Therefore, inflation can be a major driver as well as other metrics which impact the Fed decisions.
Dow Theory is a method for identifying the primary trend of the stock market developed by Charles Dow. A key step is to compare the direction of the Dow Jones Industrial Average (DJIA) and the Dow Jones Transportation Average (DJTA) and only follow trends where both are moving in the same direction. Volume is a confirmatory criteria. The theory uses elements of peak and trough analysis. Dow's theory posits three trend phases: accumulation, when smart money starts buying or selling; public participation, when the wider public joins in; and distribution, when the smart money exits.
There are a number of ways to trade the DJIA. One is to use ETFs which allow investors to trade the DJIA as a single security, rather than having to buy shares in all 30 constituent companies. A leading example is the SPDR Dow Jones Industrial Average ETF (DIA). DJIA futures contracts enable traders to speculate on the future value of the index and Options provide the right, but not the obligation, to buy or sell the index at a predetermined price in the future. Mutual funds enable investors to buy a share of a diversified portfolio of DJIA stocks thus providing exposure to the overall index.
![]()
Created
: 2025.07.16
![]()
Last updated
: 2025.07.16

FXStreet is a forex information website, delivering market analysis and news articles 24/7.
It features a number of articles contributed by well-known analysts, in addition to the ones by its editorial team.
Founded in 2000 by Francesc Riverola, a Spanish economist, it has grown to become a world-renowned information website.
We hope you find this article useful. Any comments or suggestions will be greatly appreciated.
We are also looking for writers with extensive experience in forex and crypto to join us.
please contact us at [email protected].
Disclaimer:![]()
All information and content provided on this website is provided for informational purposes only and is not intended to solicit any investment. Although all efforts are made in order to ensure that the information is correct, no guarantee is provided for the accuracy of any content on this website. Any decision made shall be the responsibility of the investor and Myforex does not take any responsibility whatsoever regarding the use of any information provided herein.
The content provided on this website belongs to Myforex and, where stated, the relevant licensors. All rights are reserved by Myforex and the relevant licensors, and no content of this website, whether in full or in part, shall be copied or displayed elsewhere without the explicit written permission of the relevant copyright holder. If you wish to use any part of the content provided on this website, please ensure that you contact Myforex.
Myforex uses cookies to improve the convenience and functionality of this website. This website may include cookies not only by us but also by third parties (advertisers, log analysts, etc.) for the purpose of tracking the activities of users. Cookie policy
