Created
: 2025.07.10


![]() 2025.07.10 03:18
2025.07.10 03:18
The British Pound (GBP) eases slightly against the Japanese Yen (JPY) on Wednesday, retreating after rising to 199.83 -- its highest level since late July 2024. The mild pullback appears to be driven by profit-taking and a technical correction, while the Japanese Yen regains some strength across the board after being pressured earlier this week by renewed US tariff threats and weak wage data.
The GBP/JPY is drifting lower during the American trading hours. At the time of writing, the cross is trading around 198.90, down 0.17% on the day, as bulls take a breather following the pair's strong rally to near one-year highs.
On the trade front, Japan is navigating heightened pressure from Washington's aggressive tariff campaign. US President Trump has announced sweeping 25% tariffs on all Japanese imports, set to take effect on August 1. In contrast, the UK has emerged as one of the few early movers to secure a deal with the US, having finalized an Economic Prosperity Agreement that lowers tariffs on key exports like steel, aluminum, and automobiles. The deal has helped cushion the British Pound against broader trade-related volatility, while the Japanese Yen remains under pressure as Tokyo races to negotiate similar exemptions before the August deadline.
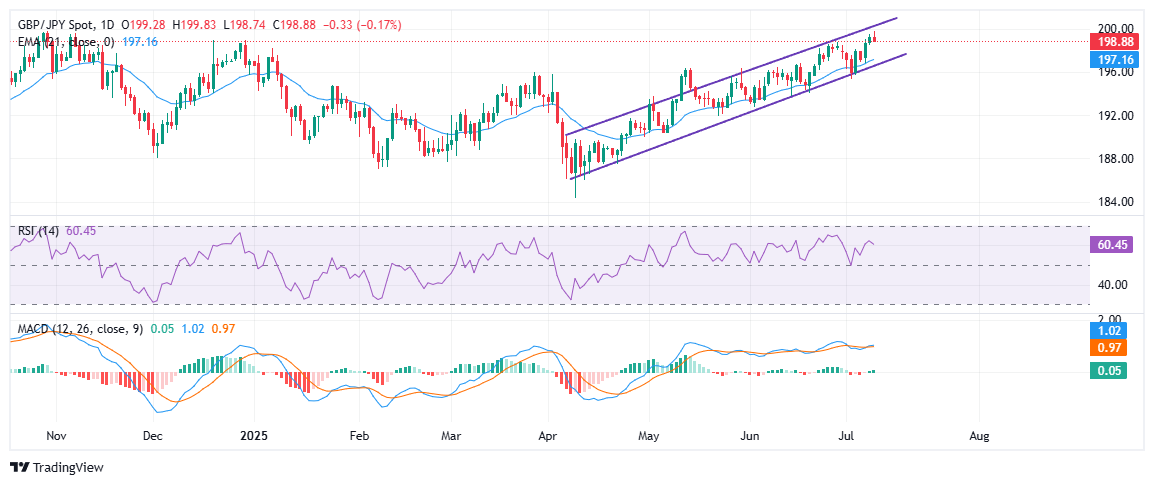
From a technical perspective, the GBP/JPY pair remains in a well-defined ascending channel, with prices currently pulling back after testing the upper boundary, just shy of the psychological 200.00 level. The modest decline appears to be part of a technical correction following the pair's extended bullish run.
The broader uptrend remains intact, as the pair continues to trade above the 21-day Exponential Moving Average (EMA) at 197.16, which closely aligns with the lower boundary of the ascending channel and has consistently served as dynamic support since early May. A decisive break below this level could open the door for a deeper correction toward the June 19 low near 194.00, with further downside risk if that level fails to hold. Until then, the overall bullish structure remains in place.
Momentum indicators offer a mixed-to-positive bias. The Relative Strength Index (RSI) is hovering around 60, suggesting bullish momentum remains but is not yet in overbought territory. Meanwhile, the MACD indicator shows a positive crossover, with the MACD line (blue) holding just above the signal line (orange), reflecting continued bullish momentum. However, the narrowing gap between the lines suggests a slowing of upside momentum in the short term. Traders should watch for a daily close above 200.00 for potential breakout confirmation, while a close below 197.00 may open the door for a deeper pullback toward 194.50-195.00 support.
The table below shows the percentage change of Japanese Yen (JPY) against listed major currencies today. Japanese Yen was the strongest against the Canadian Dollar.
| USD | EUR | GBP | JPY | CAD | AUD | NZD | CHF | |
|---|---|---|---|---|---|---|---|---|
| USD | 0.09% | -0.04% | -0.22% | 0.20% | -0.17% | -0.01% | -0.25% | |
| EUR | -0.09% | -0.11% | -0.31% | 0.12% | -0.22% | -0.10% | -0.22% | |
| GBP | 0.04% | 0.11% | -0.14% | 0.23% | -0.19% | -0.05% | -0.20% | |
| JPY | 0.22% | 0.31% | 0.14% | 0.38% | 0.04% | 0.19% | -0.02% | |
| CAD | -0.20% | -0.12% | -0.23% | -0.38% | -0.31% | -0.21% | -0.33% | |
| AUD | 0.17% | 0.22% | 0.19% | -0.04% | 0.31% | 0.12% | 0.00% | |
| NZD | 0.01% | 0.10% | 0.05% | -0.19% | 0.21% | -0.12% | -0.15% | |
| CHF | 0.25% | 0.22% | 0.20% | 0.02% | 0.33% | -0.01% | 0.15% |
The heat map shows percentage changes of major currencies against each other. The base currency is picked from the left column, while the quote currency is picked from the top row. For example, if you pick the Japanese Yen from the left column and move along the horizontal line to the US Dollar, the percentage change displayed in the box will represent JPY (base)/USD (quote).
![]()
Created
: 2025.07.10
![]()
Last updated
: 2025.07.10

FXStreet is a forex information website, delivering market analysis and news articles 24/7.
It features a number of articles contributed by well-known analysts, in addition to the ones by its editorial team.
Founded in 2000 by Francesc Riverola, a Spanish economist, it has grown to become a world-renowned information website.
We hope you find this article useful. Any comments or suggestions will be greatly appreciated.
We are also looking for writers with extensive experience in forex and crypto to join us.
please contact us at [email protected].
Disclaimer:![]()
All information and content provided on this website is provided for informational purposes only and is not intended to solicit any investment. Although all efforts are made in order to ensure that the information is correct, no guarantee is provided for the accuracy of any content on this website. Any decision made shall be the responsibility of the investor and Myforex does not take any responsibility whatsoever regarding the use of any information provided herein.
The content provided on this website belongs to Myforex and, where stated, the relevant licensors. All rights are reserved by Myforex and the relevant licensors, and no content of this website, whether in full or in part, shall be copied or displayed elsewhere without the explicit written permission of the relevant copyright holder. If you wish to use any part of the content provided on this website, please ensure that you contact Myforex.
Myforex uses cookies to improve the convenience and functionality of this website. This website may include cookies not only by us but also by third parties (advertisers, log analysts, etc.) for the purpose of tracking the activities of users. Cookie policy
