Created
: 2025.07.09


![]() 2025.07.09 12:58
2025.07.09 12:58
Gold price (XAU/USD) trades with a negative bias below the $3,300 mark during the Asian session on Wednesday and drops to a one-and-a-half-week low in the last week. The growing acceptance that the Federal Reserve (Fed) will keep interest rates steady for an extended period amid expectations that steep US tariffs would underpin inflation in the coming months had been a key factor behind the recent rise in the US Treasury bond yields. This keeps the US Dollar (USD) pinned near a two-week high set on Tuesday and turns out to be a key factor weighing on the non-yielding yellow metal.
Meanwhile, the global risk sentiment remains fragile on the back of concerns about the potential economic fallout from Trump's trade tariffs. This is evident from a generally weaker tone around the equity markets and could offer some support to the safe-haven Gold price. Traders might also opt to wait for more cues about the Fed's rate-cut path before placing aggressive directional bets. Hence, the focus remains glued to the release of FOMC meeting minutes, due later during the US session, which will influence the USD price dynamics and provide a fresh impetus to the XAU/USD pair.
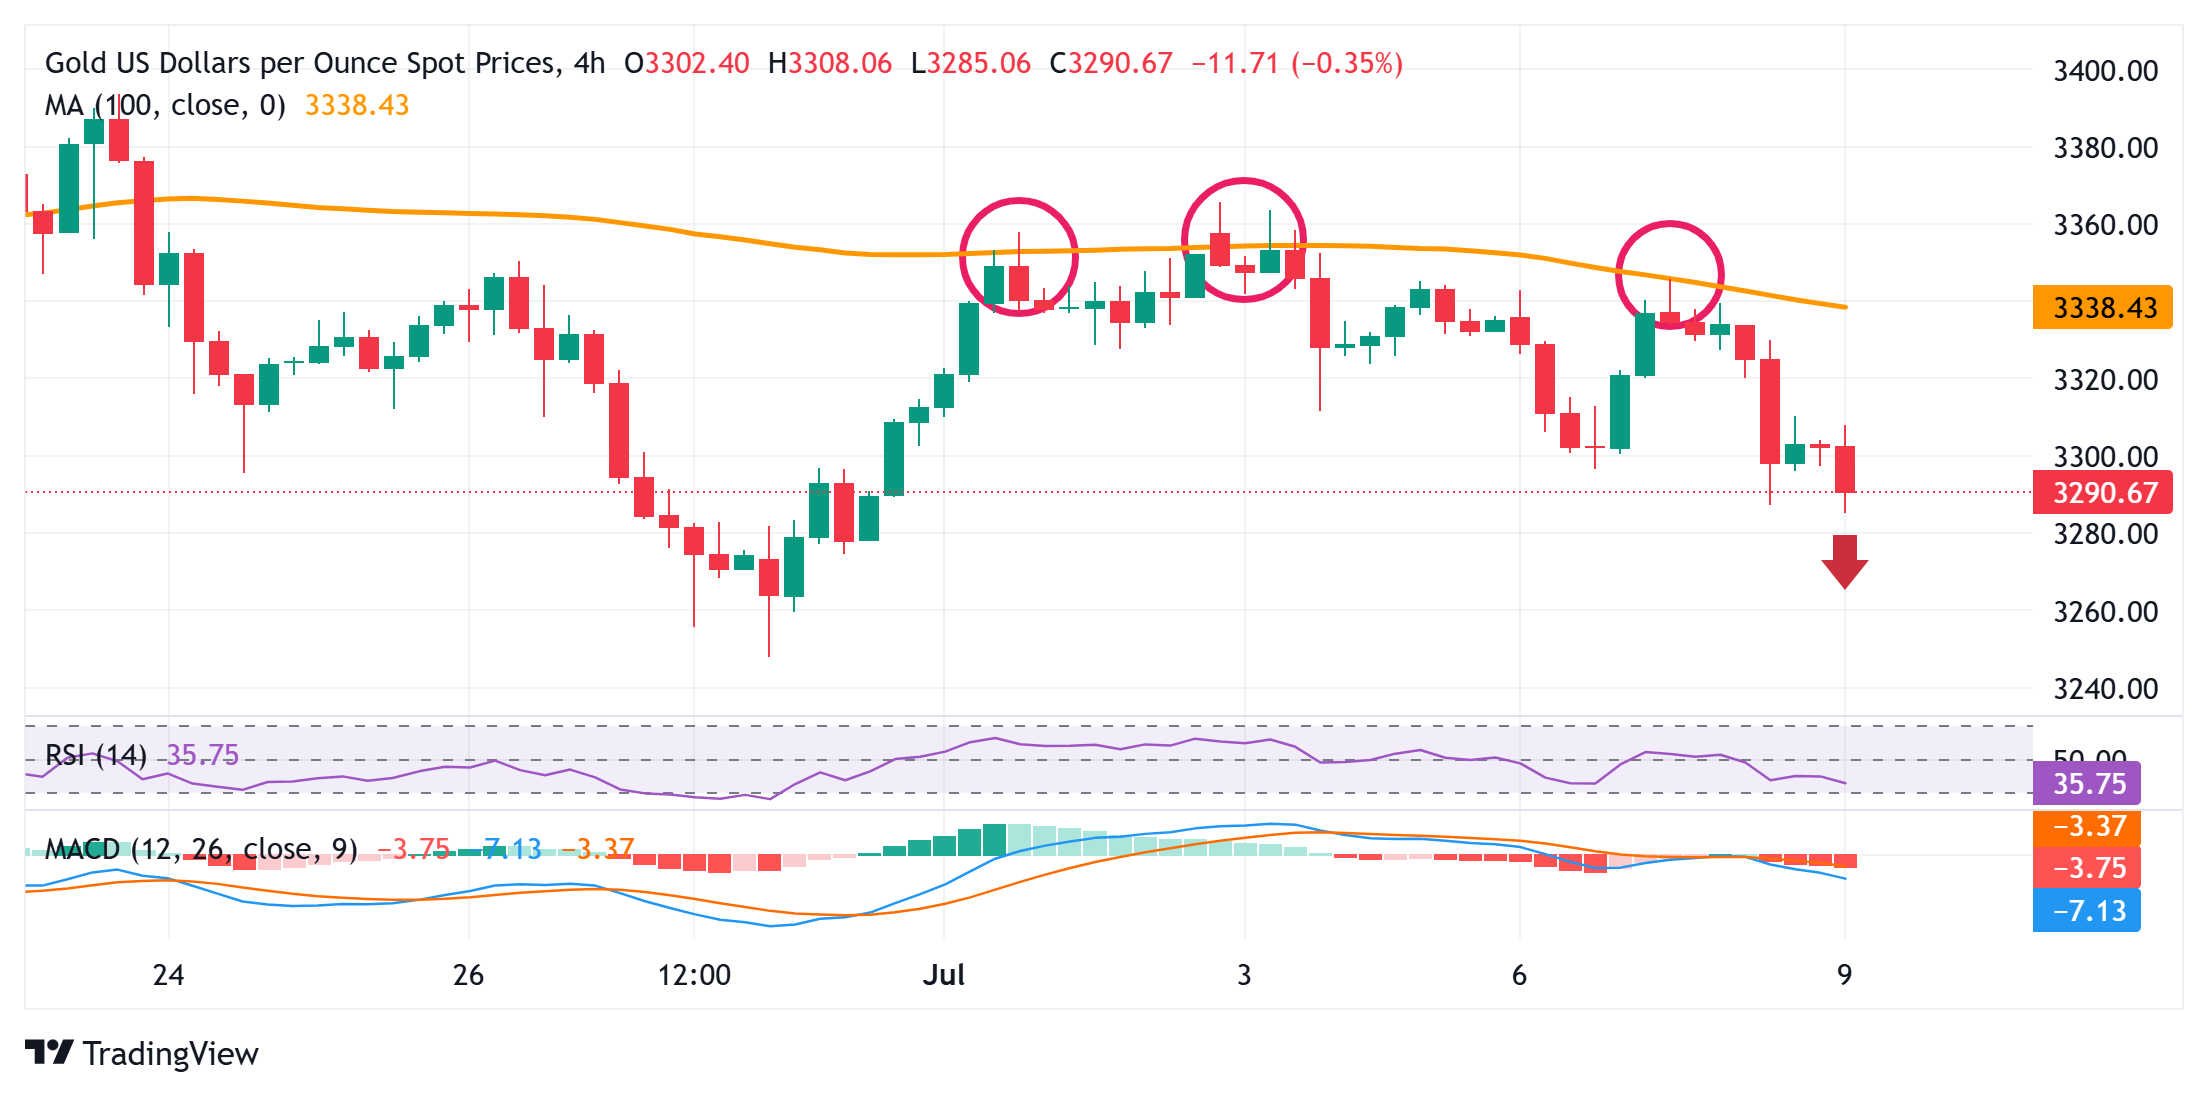
The overnight failure near the 100-period Simple Moving Average (SMA) pivotal resistance on the 4-hour chart and acceptance below the $3,300 mark could be seen as a key trigger for the XAU/USD bears. Moreover, oscillators on the daily chart have just started gaining negative traction and suggest that the path of least resistance for the Gold price is to the downside. Hence, a subsequent fall towards the next relevant support near the $3,270 horizontal zone, en route to the $3,248-3,247 region or the June monthly swing low, looks like a distinct possibility.
On the flip side, attempted recovery beyond the $3,310 immediate hurdle might now face some hurdle near the $3,326 area. Any further move up might continue to attract fresh sellers near the 100-SMA on the 4-hour chart, currently pegged near the $3,340 region. Some follow-through buying, leading to subsequent strength beyond the $3,359-3,360 supply zone, could trigger a short-covering move and allow the Gold price to reclaim the $3,400 round figure.
The table below shows the percentage change of US Dollar (USD) against listed major currencies last 7 days. US Dollar was the strongest against the Japanese Yen.
| USD | EUR | GBP | JPY | CAD | AUD | NZD | CHF | |
|---|---|---|---|---|---|---|---|---|
| USD | 0.86% | 1.33% | 2.59% | 0.31% | 0.95% | 1.83% | 0.79% | |
| EUR | -0.86% | 0.43% | 1.69% | -0.56% | 0.12% | 1.08% | -0.05% | |
| GBP | -1.33% | -0.43% | 1.28% | -0.99% | -0.37% | 0.62% | -0.51% | |
| JPY | -2.59% | -1.69% | -1.28% | -2.20% | -1.60% | -0.69% | -1.75% | |
| CAD | -0.31% | 0.56% | 0.99% | 2.20% | 0.65% | 1.62% | 0.49% | |
| AUD | -0.95% | -0.12% | 0.37% | 1.60% | -0.65% | 1.02% | -0.15% | |
| NZD | -1.83% | -1.08% | -0.62% | 0.69% | -1.62% | -1.02% | -1.13% | |
| CHF | -0.79% | 0.05% | 0.51% | 1.75% | -0.49% | 0.15% | 1.13% |
The heat map shows percentage changes of major currencies against each other. The base currency is picked from the left column, while the quote currency is picked from the top row. For example, if you pick the US Dollar from the left column and move along the horizontal line to the Japanese Yen, the percentage change displayed in the box will represent USD (base)/JPY (quote).
![]()
Created
: 2025.07.09
![]()
Last updated
: 2025.07.09

FXStreet is a forex information website, delivering market analysis and news articles 24/7.
It features a number of articles contributed by well-known analysts, in addition to the ones by its editorial team.
Founded in 2000 by Francesc Riverola, a Spanish economist, it has grown to become a world-renowned information website.
We hope you find this article useful. Any comments or suggestions will be greatly appreciated.
We are also looking for writers with extensive experience in forex and crypto to join us.
please contact us at [email protected].
Disclaimer:![]()
All information and content provided on this website is provided for informational purposes only and is not intended to solicit any investment. Although all efforts are made in order to ensure that the information is correct, no guarantee is provided for the accuracy of any content on this website. Any decision made shall be the responsibility of the investor and Myforex does not take any responsibility whatsoever regarding the use of any information provided herein.
The content provided on this website belongs to Myforex and, where stated, the relevant licensors. All rights are reserved by Myforex and the relevant licensors, and no content of this website, whether in full or in part, shall be copied or displayed elsewhere without the explicit written permission of the relevant copyright holder. If you wish to use any part of the content provided on this website, please ensure that you contact Myforex.
Myforex uses cookies to improve the convenience and functionality of this website. This website may include cookies not only by us but also by third parties (advertisers, log analysts, etc.) for the purpose of tracking the activities of users. Cookie policy
