Created
: 2025.07.01


![]() 2025.07.01 11:17
2025.07.01 11:17
The Australian Dollar (AUD) edges lower against the US Dollar (USD) on Tuesday after registering more than 0.50% losses in the previous session. The AUD/USD pair loses ground as Australia's S&P Global Manufacturing Purchasing Managers' Index (PMI) falls to 50.6 in June from the previous 51.0. The output declined to its lowest reading since February as new orders fell for the first time in five months, due to adequate client inventories and weaker market conditions.
China's Caixin Manufacturing Purchasing Managers' Index improved to 50.4 in June from 48.3 in May, according to the latest data released on Tuesday. The reading surpassed the market forecast of 49.0. This is important to note that any economic change in China could impact AUD as both countries are close trade partners.
The AUD/USD pair may regain its ground as the US Dollar continues to face challenges amid growing uncertainty over the Federal Reserve (Fed) policy outlook and a rising fiscal concern in the United States (US). Additionally, traders adopt caution over a sweeping tax and spending bill currently under consideration in the Senate, which could add $3.3 trillion to the national debt.
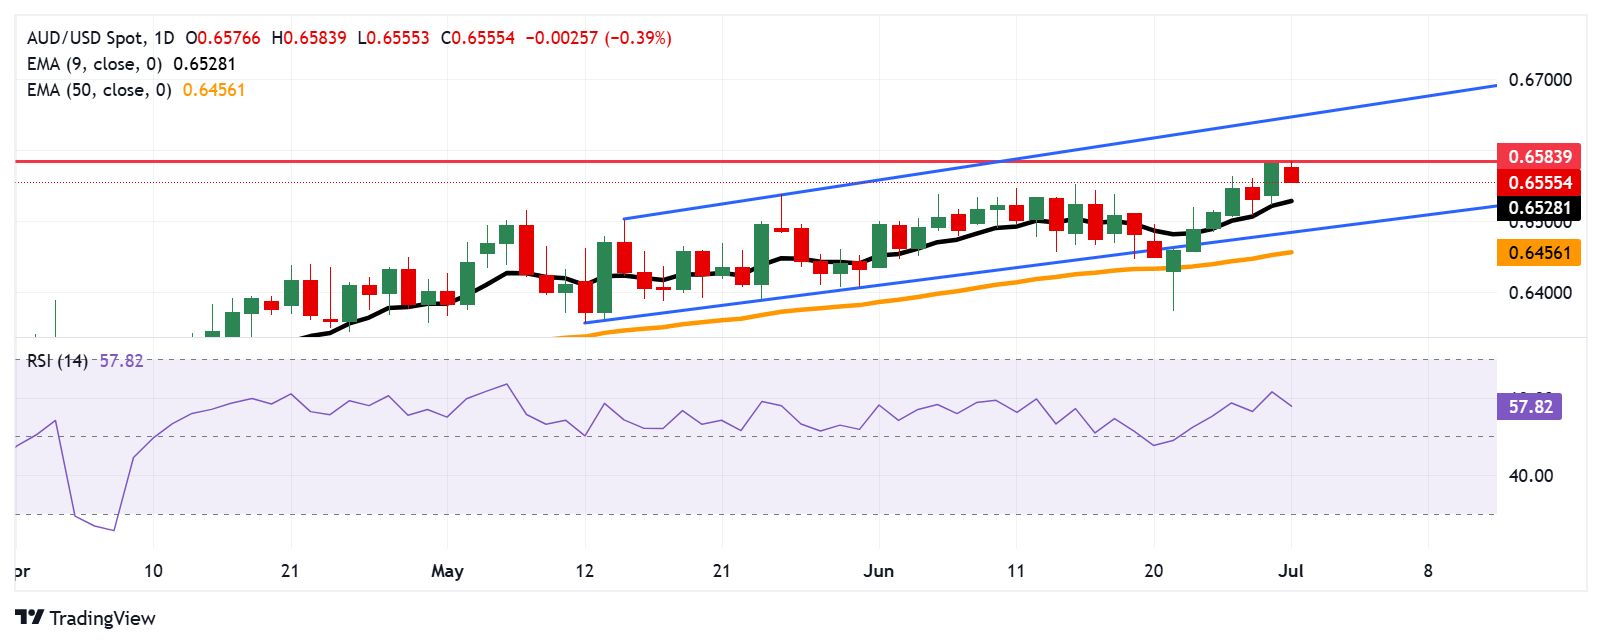
The AUD/USD pair is trading around 0.6560 on Tuesday. The daily technical analysis indicates a persistent bullish bias as the pair remains within the ascending channel pattern. The 14-day Relative Strength Index (RSI) is positioned above the 50 mark. Additionally, the pair rises above the nine-day Exponential Moving Average (EMA), indicating that short-term price momentum is stronger.
On the upside, the AUD/USD pair could rebound to the fresh eight-month high of 0.6583, which was recorded on July 1, followed by the upper boundary of the ascending channel around 0.6650.
The nine-day EMA at 0.6529 appears as the primary support. A break below this level would weaken the short-term price momentum and put downward pressure on the AUD/USD pair to test the lower boundary of the ascending channel around 0.6490, aligned with the 50-day EMA at 0.6456.
The table below shows the percentage change of Australian Dollar (AUD) against listed major currencies today. Australian Dollar was the weakest against the Japanese Yen.
| USD | EUR | GBP | JPY | CAD | AUD | NZD | CHF | |
|---|---|---|---|---|---|---|---|---|
| USD | 0.07% | 0.04% | -0.17% | 0.07% | 0.29% | 0.21% | -0.00% | |
| EUR | -0.07% | -0.02% | -0.36% | 0.00% | 0.31% | 0.13% | -0.06% | |
| GBP | -0.04% | 0.02% | -0.22% | 0.05% | 0.34% | 0.16% | -0.03% | |
| JPY | 0.17% | 0.36% | 0.22% | 0.30% | 0.46% | 0.37% | 0.19% | |
| CAD | -0.07% | -0.00% | -0.05% | -0.30% | 0.21% | 0.10% | -0.09% | |
| AUD | -0.29% | -0.31% | -0.34% | -0.46% | -0.21% | -0.18% | -0.37% | |
| NZD | -0.21% | -0.13% | -0.16% | -0.37% | -0.10% | 0.18% | -0.19% | |
| CHF | 0.00% | 0.06% | 0.03% | -0.19% | 0.09% | 0.37% | 0.19% |
The heat map shows percentage changes of major currencies against each other. The base currency is picked from the left column, while the quote currency is picked from the top row. For example, if you pick the Australian Dollar from the left column and move along the horizontal line to the US Dollar, the percentage change displayed in the box will represent AUD (base)/USD (quote).
The Caixin Manufacturing Purchasing Managers Index (PMI), released on a monthly basis by Caixin Insight Group and S&P Global, is a leading indicator gauging business activity in China's manufacturing sector. The data is derived from surveys of senior executives at both private-sector and state-owned companies. Survey responses reflect the change, if any, in the current month compared to the previous month and can anticipate changing trends in official data series such as Gross Domestic Product (GDP), industrial production, employment and inflation.The index varies between 0 and 100, with levels of 50.0 signaling no change over the previous month. A reading above 50 indicates that the manufacturing economy is generally expanding, a bullish sign for the Renminbi (CNY). Meanwhile, a reading below 50 signals that activity among goods producers is generally declining, which is seen as bearish for CNY.
Read more.Last release: Tue Jul 01, 2025 01:45
Frequency: Monthly
Actual: 50.4
Consensus: 49
Previous: 48.3
Source: IHS Markit
![]()
Created
: 2025.07.01
![]()
Last updated
: 2025.07.01

FXStreet is a forex information website, delivering market analysis and news articles 24/7.
It features a number of articles contributed by well-known analysts, in addition to the ones by its editorial team.
Founded in 2000 by Francesc Riverola, a Spanish economist, it has grown to become a world-renowned information website.
We hope you find this article useful. Any comments or suggestions will be greatly appreciated.
We are also looking for writers with extensive experience in forex and crypto to join us.
please contact us at [email protected].
Disclaimer:![]()
All information and content provided on this website is provided for informational purposes only and is not intended to solicit any investment. Although all efforts are made in order to ensure that the information is correct, no guarantee is provided for the accuracy of any content on this website. Any decision made shall be the responsibility of the investor and Myforex does not take any responsibility whatsoever regarding the use of any information provided herein.
The content provided on this website belongs to Myforex and, where stated, the relevant licensors. All rights are reserved by Myforex and the relevant licensors, and no content of this website, whether in full or in part, shall be copied or displayed elsewhere without the explicit written permission of the relevant copyright holder. If you wish to use any part of the content provided on this website, please ensure that you contact Myforex.
Myforex uses cookies to improve the convenience and functionality of this website. This website may include cookies not only by us but also by third parties (advertisers, log analysts, etc.) for the purpose of tracking the activities of users. Cookie policy
