Created
: 2025.06.19


![]() 2025.06.19 20:49
2025.06.19 20:49
The Indian Rupee (INR) extends its losing streak for a third consecutive day against the US Dollar (USD) on Wednesday, sliding to a three-month low as the escalating Middle East conflict fuels fresh supply worries and keeps Crude Oil prices elevated. Higher Oil costs continue to strain India's import bill, adding persistent pressure on the Rupee.
The USD/INR pair is trading higher at around ₹86.71, slightly off its intraday peak of ₹86.89 seen during European trading hours. Meanwhile, the US Dollar Index (DXY), which tracks the Greenback's value against six major currencies, holds steady near 98.95 after the Federal Reserve (Fed) left interest rates unchanged on Wednesday, reinforcing broad US Dollar resilience amid an already uncertain global outlook. Trading volumes remain thin as United States (US) financial markets stay closed on Thursday for the Juneteenth holiday, limiting price action until liquidity returns on Friday.
As the Iran-Israel conflict enters its seventh day, both nations have continued heavy strikes -- Israel targeting Iran's nuclear and military installations, and Iran responding with waves of ballistic missiles and drones toward Israeli territory, including civilian hospitals. The US has reinforced its regional posture by deploying additional naval vessels and aircraft assets to serve as a deterrent amid rising tensions. US President Donald Trump has publicly backed Israel's campaign, praising its strikes as "excellent" and warning Iran of "even more brutal" action if it fails to capitulate on its nuclear ambitions. Trump remains non-committal about direct US military involvement, saying, "I may do it. I may not do it. I mean, nobody knows what I'm going to do."
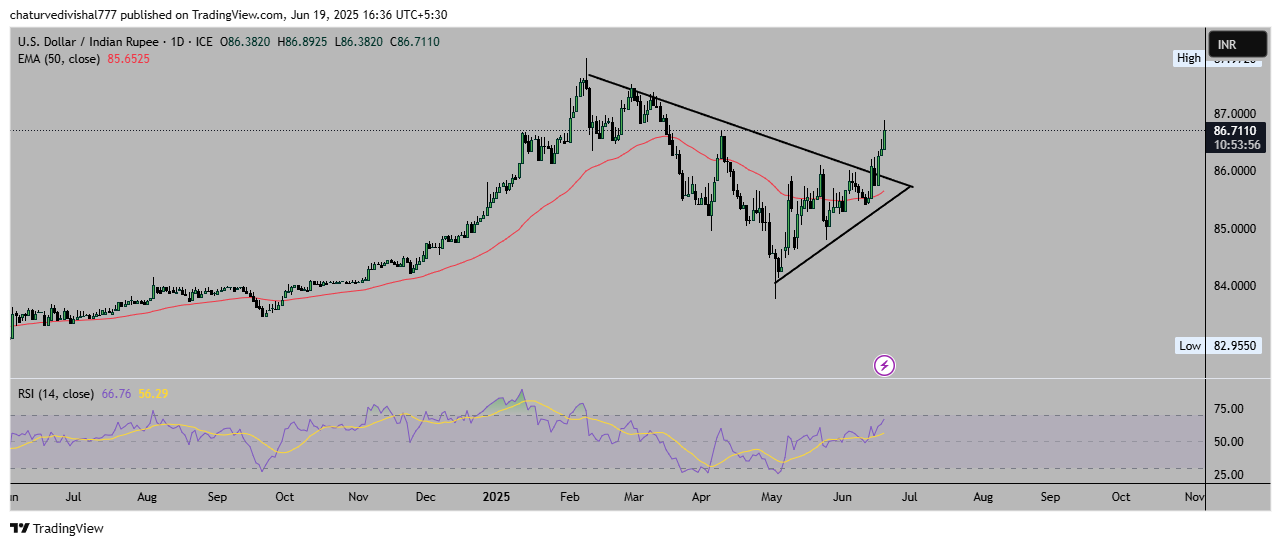
The USD/INR pair has staged a strong breakout from a multi-month symmetrical triangle pattern on the daily chart, printing consecutive bullish candles that signal renewed upward momentum. Price action remains comfortably above the breakout zone, with the 50-day Exponential Moving Average (EMA) near 85.65 now acting as dynamic support if any profit-taking emerges.
The daily Relative Strength Index (RSI) is holding around 66, indicating healthy bullish momentum with room to test overbought levels before any pullback. If the pair maintains this bullish structure, a clear push above the 87.00 round number could pave the way toward the next resistance at 87.50-88.00. On the downside, dips back toward 86.00-86.20 may attract fresh buying interest, keeping the broader uptrend intact.
The table below shows the percentage change of Indian Rupee (INR) against listed major currencies today. Indian Rupee was the strongest against the New Zealand Dollar.
| USD | EUR | GBP | JPY | CAD | AUD | NZD | INR | |
|---|---|---|---|---|---|---|---|---|
| USD | 0.04% | 0.07% | 0.36% | 0.17% | 0.80% | 0.96% | 0.29% | |
| EUR | -0.04% | 0.02% | 0.30% | 0.07% | 0.68% | 0.87% | 0.35% | |
| GBP | -0.07% | -0.02% | 0.29% | 0.05% | 0.66% | 0.94% | 0.22% | |
| JPY | -0.36% | -0.30% | -0.29% | -0.22% | 0.29% | 0.52% | -0.03% | |
| CAD | -0.17% | -0.07% | -0.05% | 0.22% | 0.53% | 0.81% | 0.25% | |
| AUD | -0.80% | -0.68% | -0.66% | -0.29% | -0.53% | 0.33% | -0.37% | |
| NZD | -0.96% | -0.87% | -0.94% | -0.52% | -0.81% | -0.33% | -0.80% | |
| INR | -0.29% | -0.35% | -0.22% | 0.03% | -0.25% | 0.37% | 0.80% |
The heat map shows percentage changes of major currencies against each other. The base currency is picked from the left column, while the quote currency is picked from the top row. For example, if you pick the Indian Rupee from the left column and move along the horizontal line to the US Dollar, the percentage change displayed in the box will represent INR (base)/USD (quote).
![]()
Created
: 2025.06.19
![]()
Last updated
: 2025.06.19

FXStreet is a forex information website, delivering market analysis and news articles 24/7.
It features a number of articles contributed by well-known analysts, in addition to the ones by its editorial team.
Founded in 2000 by Francesc Riverola, a Spanish economist, it has grown to become a world-renowned information website.
We hope you find this article useful. Any comments or suggestions will be greatly appreciated.
We are also looking for writers with extensive experience in forex and crypto to join us.
please contact us at [email protected].
Disclaimer:![]()
All information and content provided on this website is provided for informational purposes only and is not intended to solicit any investment. Although all efforts are made in order to ensure that the information is correct, no guarantee is provided for the accuracy of any content on this website. Any decision made shall be the responsibility of the investor and Myforex does not take any responsibility whatsoever regarding the use of any information provided herein.
The content provided on this website belongs to Myforex and, where stated, the relevant licensors. All rights are reserved by Myforex and the relevant licensors, and no content of this website, whether in full or in part, shall be copied or displayed elsewhere without the explicit written permission of the relevant copyright holder. If you wish to use any part of the content provided on this website, please ensure that you contact Myforex.
Myforex uses cookies to improve the convenience and functionality of this website. This website may include cookies not only by us but also by third parties (advertisers, log analysts, etc.) for the purpose of tracking the activities of users. Cookie policy
