Created
: 2025.06.18


![]() 2025.06.18 01:08
2025.06.18 01:08
The pair is falling back toward 0.6500 on Tuesday as traders digest mixed US Retail Sales data, monitor rising geopolitical tensions, and prepare for Wednesday's Federal Reserve (Fed) policy decision and Summary of Economic Projections.
The Australian Dollar (AUD) is drawing modest support from elevated commodity prices and a broadly weaker US Dollar (USD). However, the upside remains capped by mounting global uncertainty and concerns over Australia's weakening domestic outlook.
Cautious sentiment dominates as markets respond to conflicting signals in the latest US Retail Sales report. Headline sales dropped 0.9% MoM in May, missing forecasts of a 0.7% decline.
The GDP-relevant control group rose 0.4%, underscoring underlying consumer resilience. With the Fed expected to keep rates unchanged, the focus shifts to the updated dot plot and Chair Jerome Powell's guidance on the path of rates into late 2025.
In Australia, attention turns to a significant fiscal speech from Treasurer Jim Chalmers, set for delivery on Wednesday at the National Press Club. According to Reuters, Chalmers will outline structural challenges, including sluggish productivity and long-term budget sustainability.
Chalmers' tone may reinforce the view that fiscal support will remain limited, shifting the burden of stimulus to the Reserve Bank of Australia (RBA). Markets are already pricing in additional RBA easing, and if the Fed maintains a higher-for-longer stance while the RBA moves toward rate cuts, a growing policy divergence could ultimately weigh on the AUD and cap upside in the AUD/USD pair..If the Fed maintains a higher-for-longer stance while the RBA moves toward rate cuts, a growing policy divergence could ultimately weigh on the AUD and limit upside in the AUD/USD pair.
The AUD/USD pair remains confined within a rising wedge formation, with prices trading around the 10-day Simple Moving Average (SMA) at 0.6508 and below the key 61.8% Fibonacci retracement level, located near 0.6550 (measured from the decline from September to April).
The pair has edged down to 0.6511, testing the lower boundary of the wedge while holding above the key psychological support at 0.6500 and the 200-day SMA at 0.6428.
The Relative Strength Index (RSI) sits at a neutral 55, indicating steady momentum without overbought conditions.
AUD/USD daily chart
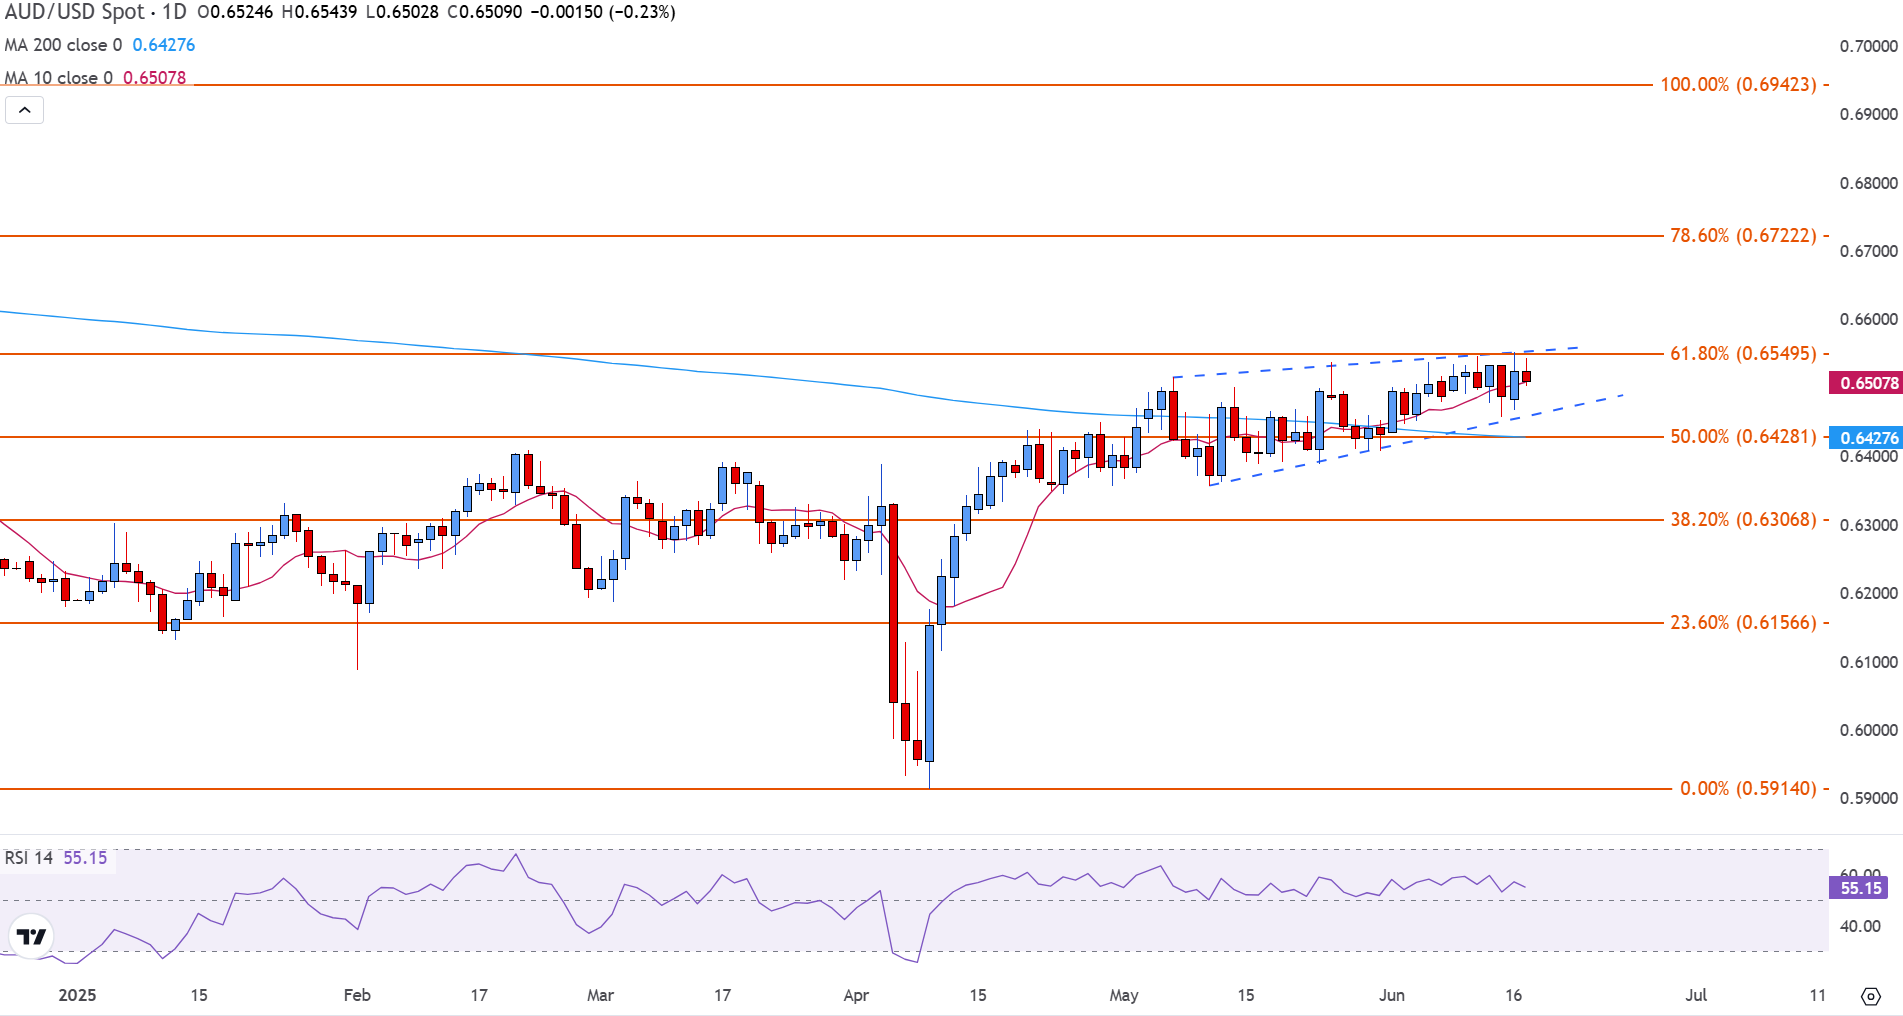
A decisive break above 0.6550 would open the door toward the 78.6% Fibonacci level at 0.6722, while a downside break below 0.6500-0.6480 would expose the next major support near 0.6428, where the 50% retracement and long-term moving average converge.
The "Dot Plot" is the popular name of the interest-rate projections by the Federal Open Market Committee (FOMC) of the US Federal Reserve (Fed), which implements monetary policy. These are published in the Summary of Economic Projections, a report in which FOMC members also release their individual projections on economic growth, the unemployment rate and inflation for the current year and the next few ones. The document consists of a chart plotting interest-rate projections, with each FOMC member's forecast represented by a dot. The Fed also adds a table summarizing the range of forecasts and the median for each indicator. This makes it easier for market participants to see how policymakers expect the US economy to perform in the near, medium and long term.
The US Federal Reserve publishes the "Dot Plot" once every other meeting, or in four of the eight yearly scheduled meetings. The Summary of Economic Projections report is published along with the monetary policy decision.
The "Dot Plot" gives a comprehensive insight into the expectations from Federal Reserve (Fed) policymakers. As projections reflect each official's projection for interest rates at the end of each year, it is considered a key forward-looking indicator. By looking at the "Dot Plot" and comparing the data to current interest-rate levels, market participants can see where policymakers expect rates to head to and the overall direction of monetary policy. As projections are released quarterly, the "Dot Plot" is widely used as a guide to figure out the terminal rate and the possible timing of a policy pivot.
The most market-moving data in the "Dot Plot" is the projection of the federal funds rate. Any change compared with previous projections is likely to influence the US Dollar (USD) valuation. Generally, if the "Dot Plot" shows that policymakers expect higher interest rates in the near term, this tends to be bullish for USD. Likewise, if projections point to lower rates ahead, the USD is likely to weaken.
![]()
Created
: 2025.06.18
![]()
Last updated
: 2025.06.18

FXStreet is a forex information website, delivering market analysis and news articles 24/7.
It features a number of articles contributed by well-known analysts, in addition to the ones by its editorial team.
Founded in 2000 by Francesc Riverola, a Spanish economist, it has grown to become a world-renowned information website.
We hope you find this article useful. Any comments or suggestions will be greatly appreciated.
We are also looking for writers with extensive experience in forex and crypto to join us.
please contact us at [email protected].
Disclaimer:![]()
All information and content provided on this website is provided for informational purposes only and is not intended to solicit any investment. Although all efforts are made in order to ensure that the information is correct, no guarantee is provided for the accuracy of any content on this website. Any decision made shall be the responsibility of the investor and Myforex does not take any responsibility whatsoever regarding the use of any information provided herein.
The content provided on this website belongs to Myforex and, where stated, the relevant licensors. All rights are reserved by Myforex and the relevant licensors, and no content of this website, whether in full or in part, shall be copied or displayed elsewhere without the explicit written permission of the relevant copyright holder. If you wish to use any part of the content provided on this website, please ensure that you contact Myforex.
Myforex uses cookies to improve the convenience and functionality of this website. This website may include cookies not only by us but also by third parties (advertisers, log analysts, etc.) for the purpose of tracking the activities of users. Cookie policy
