Created
: 2025.06.17


![]() 2025.06.17 00:25
2025.06.17 00:25
The GBP/USD surged during the North American session, rising back above the 1.36 figure as hostilities within the Israel-Iran conflict escalated over the weekend and continued into the new week. At the time of writing, the pair trades at 1.3600, gaining 0.27%.
Last Friday, the GBP/USD retreated on risk aversion and plunged to 1.3515 as Israel delivered strikes on Iran's military and nuclear facilities, alongside targeted attacks on senior officials. Since then, Iran has retaliated, and with both parties exchanging blows, a truce seems far from reach.
The Dollar began the week on the back foot, as depicted by the US Dollar Index (DXY), which tracks the performance of the buck against a basket of six currencies. The DXY is down 0.27% at 97.88.
The economic docket is light on Monday, except for the release of the New York Fed Manufacturing Index in June, plummeting for the sixth straight month to -16.0. Aside from this, all eyes are on Retail Sales for May, ahead of the Federal Reserve's (Fed) monetary policy meeting on June 17-18, which will conclude on Wednesday, followed by Fed Chair Jerome Powell's speech. Further data will be released, housing reports, and Fed Regional Banks business activity reports.
In the UK, traders are also watching the Consumer Price Index (CPI) figures, the Bank of England's (BoE) monetary policy decision, and Retail Sales data.
The Fed is expected to keep rates unchanged at 4.25%-4.50%, but traders are awaiting the release of the latest economic projections. In the UK, markets had priced in an 84.21% chance that the BoE would keep rates unchanged at 4.25%, although markets are expecting a 25-basis-point (bps) cut by the September meeting.
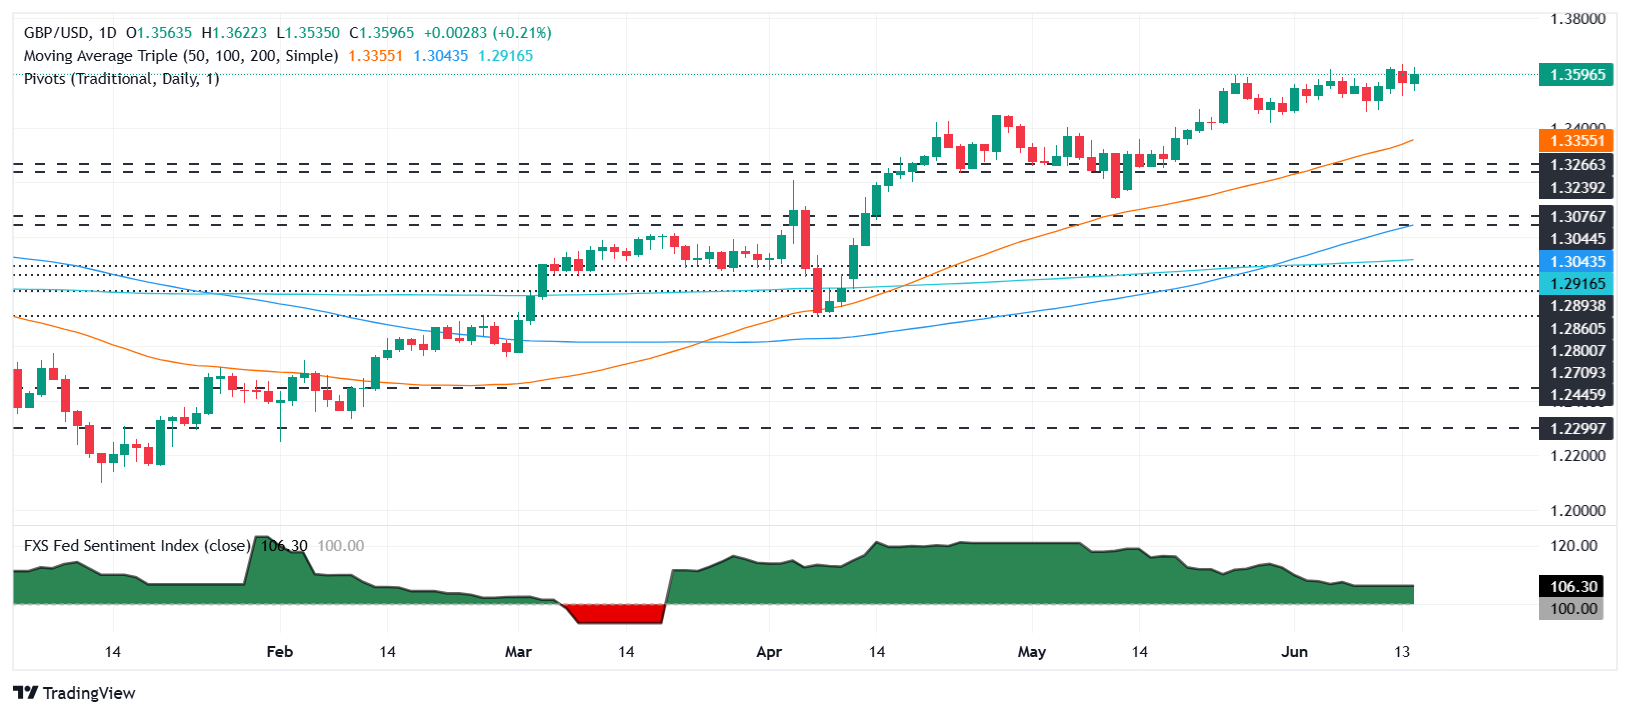
Technically speaking, the GBP/USD remains upwardly biased after bouncing off the 20-day Simple Moving Average (SMA) at 1.3541, which propelled the pair back above the 1.36 mark. The Relative Strength Index (RSI) indicates that bulls are in control, but the pair could encounter resistance as the RSI has failed to print new higher highs.
On the upside, the first resistance is the year-to-date (YTD) high at 1.3631, followed by 1.3650 and the 1.37 mark. On the flip side, the GBP/USD first support is the 20-day SMA at 1.3540, followed by the June 13 1.3515 and 1.35.
The table below shows the percentage change of British Pound (GBP) against listed major currencies this week. British Pound was the strongest against the Swiss Franc.
| USD | EUR | GBP | JPY | CAD | AUD | NZD | CHF | |
|---|---|---|---|---|---|---|---|---|
| USD | -0.41% | -0.24% | -0.32% | -0.21% | -0.81% | -0.92% | -0.08% | |
| EUR | 0.41% | 0.06% | 0.07% | 0.22% | -0.28% | -0.50% | 0.34% | |
| GBP | 0.24% | -0.06% | 0.02% | 0.15% | -0.33% | -0.55% | 0.28% | |
| JPY | 0.32% | -0.07% | -0.02% | 0.12% | -0.79% | -0.96% | -0.17% | |
| CAD | 0.21% | -0.22% | -0.15% | -0.12% | -0.54% | -0.71% | 0.12% | |
| AUD | 0.81% | 0.28% | 0.33% | 0.79% | 0.54% | -0.22% | 0.62% | |
| NZD | 0.92% | 0.50% | 0.55% | 0.96% | 0.71% | 0.22% | 0.84% | |
| CHF | 0.08% | -0.34% | -0.28% | 0.17% | -0.12% | -0.62% | -0.84% |
The heat map shows percentage changes of major currencies against each other. The base currency is picked from the left column, while the quote currency is picked from the top row. For example, if you pick the British Pound from the left column and move along the horizontal line to the US Dollar, the percentage change displayed in the box will represent GBP (base)/USD (quote).
![]()
Created
: 2025.06.17
![]()
Last updated
: 2025.06.17

FXStreet is a forex information website, delivering market analysis and news articles 24/7.
It features a number of articles contributed by well-known analysts, in addition to the ones by its editorial team.
Founded in 2000 by Francesc Riverola, a Spanish economist, it has grown to become a world-renowned information website.
We hope you find this article useful. Any comments or suggestions will be greatly appreciated.
We are also looking for writers with extensive experience in forex and crypto to join us.
please contact us at [email protected].
Disclaimer:![]()
All information and content provided on this website is provided for informational purposes only and is not intended to solicit any investment. Although all efforts are made in order to ensure that the information is correct, no guarantee is provided for the accuracy of any content on this website. Any decision made shall be the responsibility of the investor and Myforex does not take any responsibility whatsoever regarding the use of any information provided herein.
The content provided on this website belongs to Myforex and, where stated, the relevant licensors. All rights are reserved by Myforex and the relevant licensors, and no content of this website, whether in full or in part, shall be copied or displayed elsewhere without the explicit written permission of the relevant copyright holder. If you wish to use any part of the content provided on this website, please ensure that you contact Myforex.
Myforex uses cookies to improve the convenience and functionality of this website. This website may include cookies not only by us but also by third parties (advertisers, log analysts, etc.) for the purpose of tracking the activities of users. Cookie policy
