
- English
- English
- What's Myforex
- Share
- Use tools
- Get information
- What's New
- Help center
- About us
- Customer support
- Terms and policies
-

-
 PortfolioShare your portfolio and performance in real time
 -
 Events & contestsEvents and contests held by retail brokers around the world
-
-
 Real-time spread comparisonCompare spreads of major retail brokers in real time
 -
 Volatility analysisVisualize volatility as a measure of daily market activity
 -
 Swap point comparisonCompare buy and sell swap values for each broker by symbol
 -
 Market rates & chartsCheck prices for all instruments offered by each broker
 -
 IndicatorsProviding in-house developed indicators for MT4/MT5
 -
 Trading calculatorsCalculation tools for each broker to help you trade


Myforex ™ | Striving to deliver accurate and impartial information to traders


- 2025.11.19MyforexScheduled system maintenance
- 2025.11.05MetaTrader4/5 User guideModify EA/indicator settings
- 2025.10.30MyforexRelease of the Showcase Feature
- 2025.10.15MetaTrader4/5 User guideCompile EA/indicator
- 2025.10.06MetaTrader4/5 User guideCreate or load EA/indicator settings file
- 2025.10.03MetaTrader4/5 User guideTroubleshoot MT4/MT5 freezing issues
- 2025.10.03MetaTrader4/5 User guideDisplay countdown to next bar
- 2025.09.12MetaTrader4/5 User guideLock or hide objects
- 2025.09.12MyforexNew Brokers Added to Portfolio
- 2025.09.05MyforexUnlimited Trading Accounts Now Available in Portfolio
- 2025.11.19MyforexScheduled system maintenance
- 2025.10.30MyforexRelease of the Showcase Feature
- 2025.09.12MyforexNew Brokers Added to Portfolio
- 2025.09.05MyforexUnlimited Trading Accounts Now Available in Portfolio
- 2025.08.14MyforexLaunch of Login Notifications and Enhanced Unauthorized Login Prevention
- 2025.05.20MyforexScheduled system maintenance
- 2025.03.18MyforexPasskey Authentication Introduction and Scheduled Maintenance
- 2024.12.26MyforexEmail Authentication Introduction and Scheduled Maintenance
- 2024.11.13MyforexSystem Maintenance Completion
- 2024.11.12MyforexScheduled system maintenance
- 2025.11.05MetaTrader4/5 User guideModify EA/indicator settings
- 2025.10.15MetaTrader4/5 User guideCompile EA/indicator
- 2025.10.06MetaTrader4/5 User guideCreate or load EA/indicator settings file
- 2025.10.03MetaTrader4/5 User guideTroubleshoot MT4/MT5 freezing issues
- 2025.10.03MetaTrader4/5 User guideDisplay countdown to next bar
- 2025.09.12MetaTrader4/5 User guideLock or hide objects
- 2025.09.03MetaTrader4/5 User guideAdd space on the right side of chart
- 2025.08.20MetaTrader4/5 User guideResize the sub-window
- 2025.08.19MetaTrader4/5 User guideCreate a trading report
- 2025.05.13BrokerAxi


INFORMATION


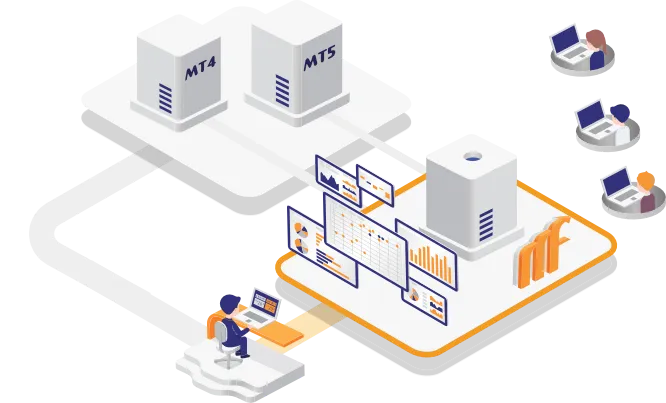
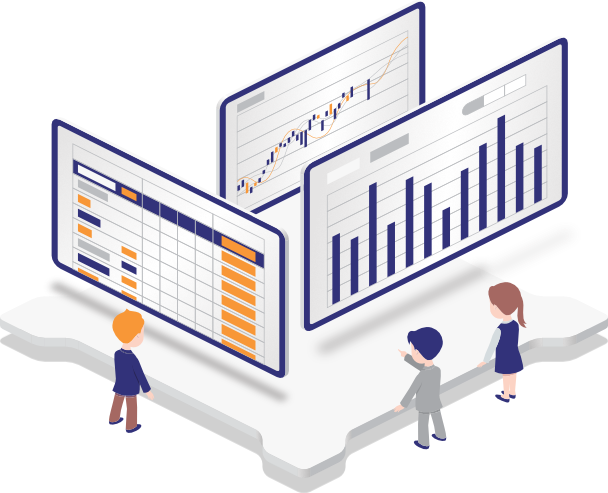
PORTFOLIO
Automatically retrieves trade data
from your MetaTrader4/5 account
Retrieves trade data from your MetaTrader4/5 account information and outputs the report for detailed analysis of your tradings. You can create portfolios and share the information with the communities on Myforex and social media.


Max. drawdown...

Max. drawdown...


Operation verified forex/crypto brokers
Brokers:24
- As of 2025.11.27
- Verified brokers list
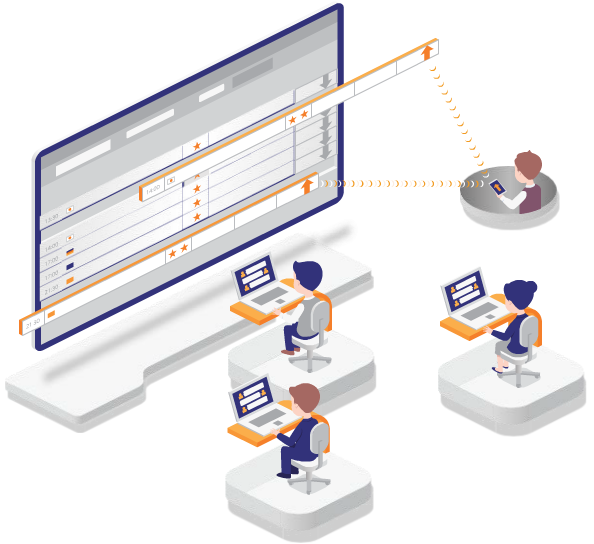
3 steps to analyze and show your trade data
Trade data will be automatically retrieved and updated from the broker's MetaTrader server and visualized as a portfolio with charts and graphs.
Register for free
(1min)
Register your email address, password, and nickname to open an account.
Register MetaTrader info
(3min)
Register your MetaTrader account information (account ID, read-only password, and server information).
Portfolio is ready
(No action needed)
Trade data will be retrieved automatically from brokers to create a portfolio from the history.
Frequently asked questions
-
What is the portfolio service?

With the portfolio service, you can visualize your asset management as simple portfolios with charts and graphs, by registering MetaTrader4/5 account information to automatically retrieve trade data from the trading broker's MetaTrader server. You can share the portfolio among traders, and also participate in the communities on Myforex based on the portfolio information.
-
What services are available with the free plan?
The free plan provides access to all Myforex news including members-only content, downloadable indicators, portfolio features, and other services. To use the services of the free plan, you need to register as a member of Myforex.
-
What do I need to do to become a member?
For registration, you need an email address. If you have a Gmail or X (formerly Twitter) account, you can use social login to register. You don't need to submit any documents to register.
-
Are there any brokers that I cannot register for portfolio?
Currently, there are 24 brokers in total, 15 international and 9 Japanese brokers, that you can register for portfolios on Myforex. Although we are planning to increase the number of available brokers in the future, some brokers are currently not available.
-
How do you handle my personal information?
We take the privacy of your personal information very seriously and have established a Privacy Policy to govern how we obtain, use, disclose, transfer and store your personal information. For more information, please refer to the Privacy policy below.
Privacy policy

Mr. Gruber
Myforex is a social media
to visualize and share your trading performance.
Sign up for free
Myforex PARTNER


Disclaimer:![]()
All information and content provided on this website is provided for informational purposes only and is not intended to solicit any investment. Although all efforts are made in order to ensure that the information is correct, no guarantee is provided for the accuracy of any content on this website. Any decision made shall be the responsibility of the investor and Myforex does not take any responsibility whatsoever regarding the use of any information provided herein.
The content provided on this website belongs to Myforex and, where stated, the relevant licensors. All rights are reserved by Myforex and the relevant licensors, and no content of this website, whether in full or in part, shall be copied or displayed elsewhere without the explicit written permission of the relevant copyright holder. If you wish to use any part of the content provided on this website, please ensure that you contact Myforex.
Myforex uses cookies to improve the convenience and functionality of this website. This website may include cookies not only by us but also by third parties (advertisers, log analysts, etc.) for the purpose of tracking the activities of users. Cookie policy
