Created
: 2025.05.27


![]() 2025.05.27 22:35
2025.05.27 22:35
Gold continues to trade within a narrowing consolidation range on Tuesday, following a record-setting rally earlier this year. After reaching an all-time high in April, the market has shifted into a holding pattern characterized by a descending wedge formation, reflecting a tightening momentum.
At the time of writing, Gold prices are trading 1.37% lower on the day, testing the 20-day Simple Moving Average (SMA) support at $3,288.
The daily chart of Gold (XAU/USD) shows the price respecting both the upper and lower boundaries of the descending wedge between $3,121 and $3,356.
The pattern began to take shape after the April all-time high (ATH) and has continued into late May, with price action producing lower highs and lower lows.
This narrowing range is indicative of decreasing volatility and suggests a potential breakout.
Gold daily chart
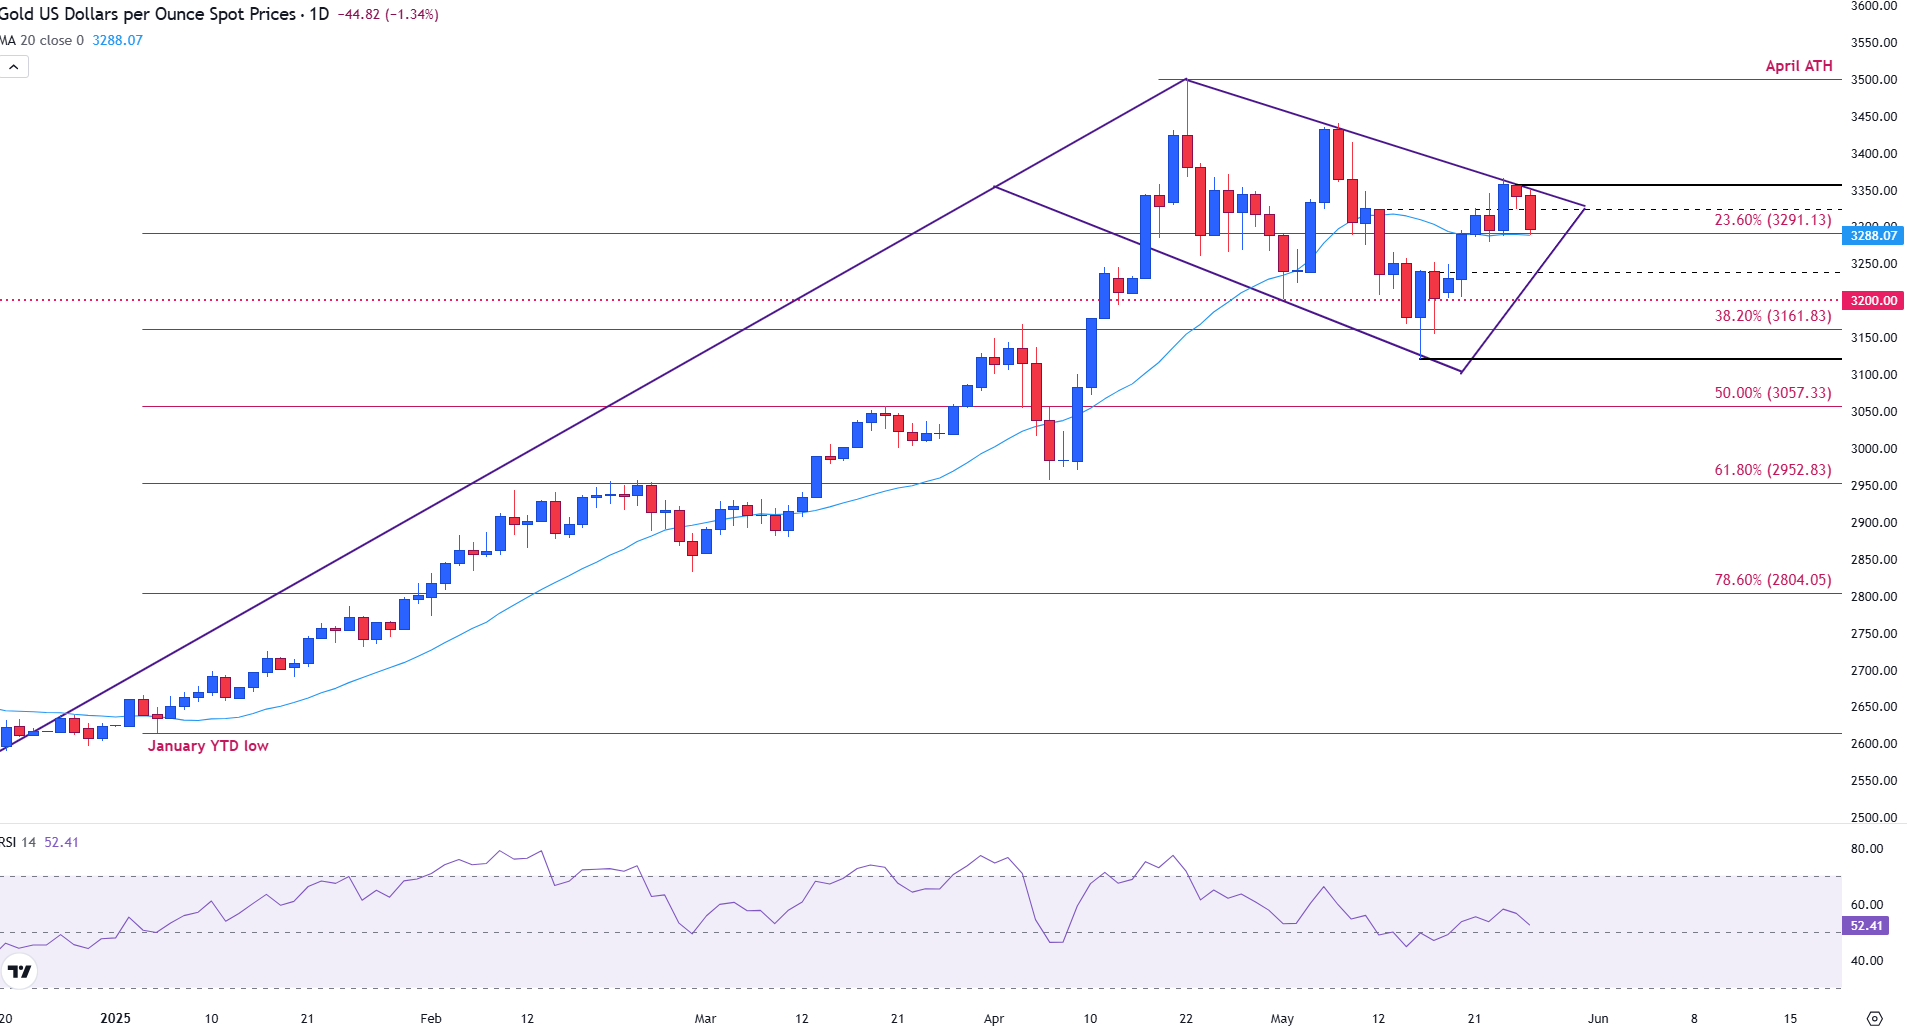
Currently, Gold is trading just below the 23.6% Fibonacci retracement (Fib) level of the January-April YTD rally at $3,291 and slightly under the 20-day Simple Moving Average (SMA), currently around $3,288.
The latest daily candle reflects a bearish rejection from the upper boundary of the wedge, signaling short-term resistance. Despite this pullback, the broader structure remains intact, and the overall technical bias still leans bullish.
The 23.6% Fibonacci level at $3,291 serves as immediate resistance, while the horizontal level around $3,200 acts as critical near-term support.
A breakdown below $3,200 could open the door toward the 38.2% retracement level at $3,161, followed by deeper support near the 50% and 61.8% Fibonacci levels at $3,057 and $2,952, respectively.
On the upside, a decisive breakout above the descending wedge, particularly a close above $3,350-$3,360, would likely attract bullish momentum. Such a breakout would target a retest of the April all-time high (ATH) at $3,500.
The Relative Strength Index (RSI) is at around 52, suggesting neutral momentum with a slight bullish tilt. This level indicates that the market is in equilibrium, supporting the view that prices are consolidating ahead of a potential breakout.
Gold has played a key role in human's history as it has been widely used as a store of value and medium of exchange. Currently, apart from its shine and usage for jewelry, the precious metal is widely seen as a safe-haven asset, meaning that it is considered a good investment during turbulent times. Gold is also widely seen as a hedge against inflation and against depreciating currencies as it doesn't rely on any specific issuer or government.
Central banks are the biggest Gold holders. In their aim to support their currencies in turbulent times, central banks tend to diversify their reserves and buy Gold to improve the perceived strength of the economy and the currency. High Gold reserves can be a source of trust for a country's solvency. Central banks added 1,136 tonnes of Gold worth around $70 billion to their reserves in 2022, according to data from the World Gold Council. This is the highest yearly purchase since records began. Central banks from emerging economies such as China, India and Turkey are quickly increasing their Gold reserves.
Gold has an inverse correlation with the US Dollar and US Treasuries, which are both major reserve and safe-haven assets. When the Dollar depreciates, Gold tends to rise, enabling investors and central banks to diversify their assets in turbulent times. Gold is also inversely correlated with risk assets. A rally in the stock market tends to weaken Gold price, while sell-offs in riskier markets tend to favor the precious metal.
The price can move due to a wide range of factors. Geopolitical instability or fears of a deep recession can quickly make Gold price escalate due to its safe-haven status. As a yield-less asset, Gold tends to rise with lower interest rates, while higher cost of money usually weighs down on the yellow metal. Still, most moves depend on how the US Dollar (USD) behaves as the asset is priced in dollars (XAU/USD). A strong Dollar tends to keep the price of Gold controlled, whereas a weaker Dollar is likely to push Gold prices up.
![]()
Created
: 2025.05.27
![]()
Last updated
: 2025.05.27

FXStreet is a forex information website, delivering market analysis and news articles 24/7.
It features a number of articles contributed by well-known analysts, in addition to the ones by its editorial team.
Founded in 2000 by Francesc Riverola, a Spanish economist, it has grown to become a world-renowned information website.
We hope you find this article useful. Any comments or suggestions will be greatly appreciated.
We are also looking for writers with extensive experience in forex and crypto to join us.
please contact us at [email protected].
Disclaimer:![]()
All information and content provided on this website is provided for informational purposes only and is not intended to solicit any investment. Although all efforts are made in order to ensure that the information is correct, no guarantee is provided for the accuracy of any content on this website. Any decision made shall be the responsibility of the investor and Myforex does not take any responsibility whatsoever regarding the use of any information provided herein.
The content provided on this website belongs to Myforex and, where stated, the relevant licensors. All rights are reserved by Myforex and the relevant licensors, and no content of this website, whether in full or in part, shall be copied or displayed elsewhere without the explicit written permission of the relevant copyright holder. If you wish to use any part of the content provided on this website, please ensure that you contact Myforex.
Myforex uses cookies to improve the convenience and functionality of this website. This website may include cookies not only by us but also by third parties (advertisers, log analysts, etc.) for the purpose of tracking the activities of users. Cookie policy
