Created
: 2025.05.26


![]() 2025.05.26 23:54
2025.05.26 23:54
The Silver (XAG/USD) pair starts the week on a steady footing, hovering near $33.40 during the American trading hours on Monday, after gaining nearly 4% in the previous week on the back of a bullish technical breakout and renewed safe-haven demand.
Spot prices edged slightly lower earlier at the start of the day as signs of easing global trade tensions provided some support to a broadly weak US Dollar (USD). However, the white metal is holding ground above the $33.00 psychological mark. Markets are in 'wait and see' mode after last week's big move, not yet ready to pick a new direction. While price action remains constructive, with buyers maintaining control as the metal trades above its short-term moving average, near-term momentum has cooled slightly. Nonetheless, the broader structure continues to favor further upside as long as key support levels hold.
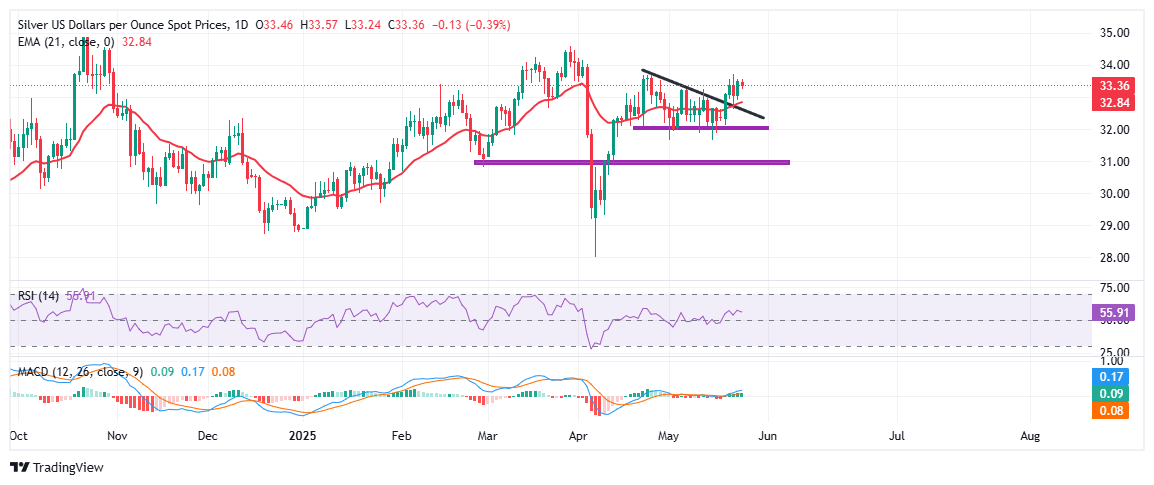
Zooming in on the daily chart, XAG/USD confirmed last week a breakout from a multi-week symmetrical triangle pattern that had capped upside momentum since mid-April and early May. Spot prices surged through the descending trendline resistance last week on Tuesday, with follow-through buying on Wednesday and a retest of the trendline on Thursday. Since the classic breakout-retest, the price has remained sideways. This breakout was confirmed with multiple daily closes above the triangle chart pattern around $32.60-$32.80, which closely aligns with the 21-day Exponential Moving Average (EMA).
At the time of writing, Silver's hanging out just below Friday's high of $33.54, suggesting a mild pause in bullish momentum. However, the short pullback remains shallow and well-contained within a consolidation range, indicating that the market is not witnessing any aggressive profit-taking.
The $33.70-$34.00 area now acts as a key resistance zone. A sustained move above this region could open the door for a retest of March's high near $34.60, followed by the $35.00 round figure as the next upside target. On the flip side, initial support is seen at the $32.80-$32.60 breakout zone, reinforced by both the upper boundary of the former triangle and the 21-day EMA. A break below this level would likely trigger a deeper correction, with 32.00 being the first line of defense, followed by the $31.00 zone near mid-April.
Momentum indicators continue to paint a moderately bullish picture. The Relative Strength Index (RSI) is holding above the neutral 50 level, currently at 56.24, showing no signs of overbought conditions and leaving room for a fresh leg higher. Meanwhile, the Moving Average Convergence Divergence (MACD) remains in positive territory with a slight bullish divergence developing, reinforcing the view that price action is pausing rather than reversing.
![]()
Created
: 2025.05.26
![]()
Last updated
: 2025.05.26

FXStreet is a forex information website, delivering market analysis and news articles 24/7.
It features a number of articles contributed by well-known analysts, in addition to the ones by its editorial team.
Founded in 2000 by Francesc Riverola, a Spanish economist, it has grown to become a world-renowned information website.
We hope you find this article useful. Any comments or suggestions will be greatly appreciated.
We are also looking for writers with extensive experience in forex and crypto to join us.
please contact us at [email protected].
Disclaimer:![]()
All information and content provided on this website is provided for informational purposes only and is not intended to solicit any investment. Although all efforts are made in order to ensure that the information is correct, no guarantee is provided for the accuracy of any content on this website. Any decision made shall be the responsibility of the investor and Myforex does not take any responsibility whatsoever regarding the use of any information provided herein.
The content provided on this website belongs to Myforex and, where stated, the relevant licensors. All rights are reserved by Myforex and the relevant licensors, and no content of this website, whether in full or in part, shall be copied or displayed elsewhere without the explicit written permission of the relevant copyright holder. If you wish to use any part of the content provided on this website, please ensure that you contact Myforex.
Myforex uses cookies to improve the convenience and functionality of this website. This website may include cookies not only by us but also by third parties (advertisers, log analysts, etc.) for the purpose of tracking the activities of users. Cookie policy
