Created
: 2025.03.24


![]() 2025.03.24 17:57
2025.03.24 17:57
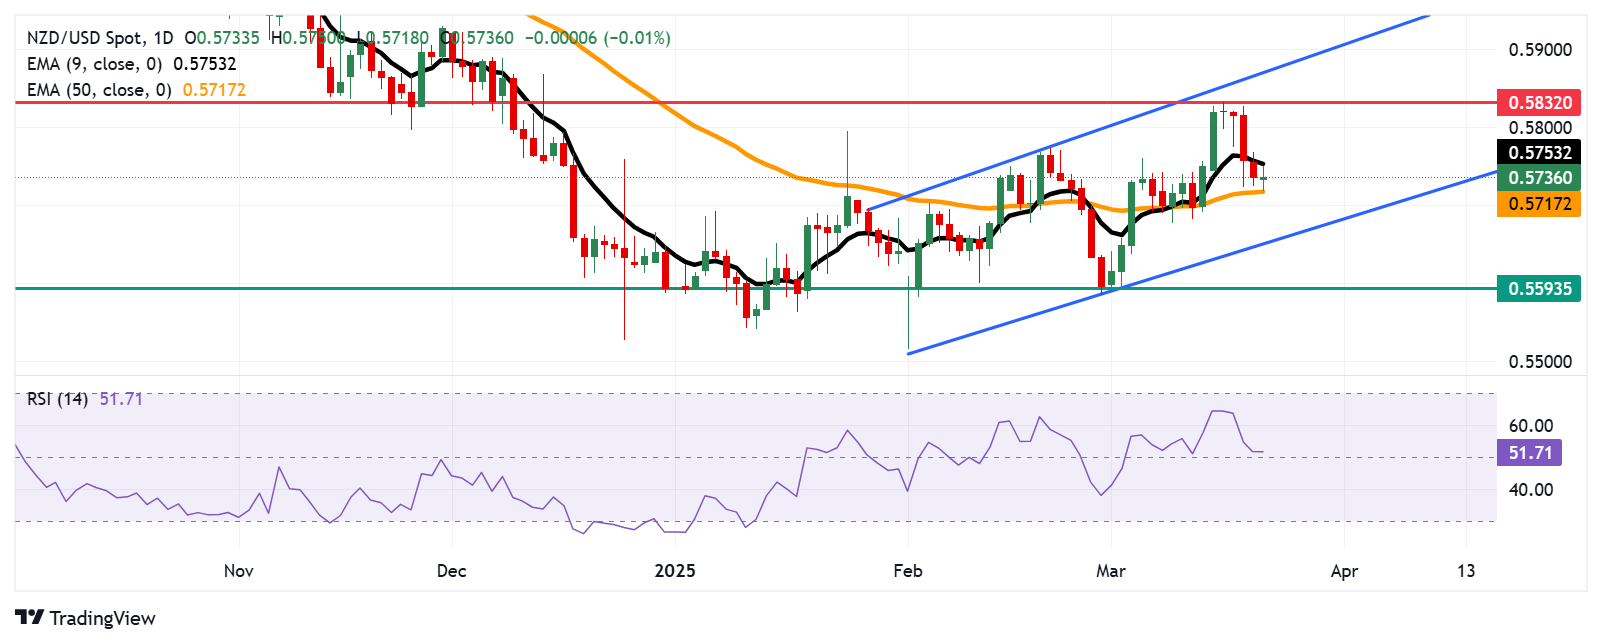
NZD/USD rebounds after four consecutive losing sessions, trading around 0.5730 during European hours on Monday. Technical analysis of the daily chart indicates a developing bullish bias as the pair moves within an ascending channel pattern.
The nine-day Exponential Moving Average (EMA) remains above the 50-day EMA, suggesting an ongoing recovery in the overall trend. However, the pair's drop below the nine-day EMA signals short-term weakness, indicating a temporary loss of momentum. This points to a bearish short-term trend within a broader bullish framework. Additionally, the 14-day Relative Strength Index (RSI) remains above 50, suggesting the positive bias is active.
On the upside, the NZD/USD pair tests the immediate barrier at a nine-day EMA of 0.5753 level. A break above this level could improve the short-term price momentum and support the pair to explore the region around the three-month high at 0.5832, reached on March 18. Further resistance appears at the upper boundary of the ascending channel near the 0.5870 level.
The immediate support is located at the 50-day EMA of 0.5717. A decisive break below this level could weaken medium-term momentum, applying downward pressure on the NZD/USD pair to navigate the area around the ascending channel's lower boundary at 0.5650 level.
A break below the channel could reinforce the bearish bias and drive the NZD/USD pair to approach the monthly low at 0.5593, recorded on March 3.
The table below shows the percentage change of New Zealand Dollar (NZD) against listed major currencies today. New Zealand Dollar was the strongest against the Japanese Yen.
| USD | EUR | GBP | JPY | CAD | AUD | NZD | CHF | |
|---|---|---|---|---|---|---|---|---|
| USD | -0.25% | -0.27% | 0.16% | -0.15% | -0.38% | -0.04% | -0.10% | |
| EUR | 0.25% | -0.12% | -0.10% | 0.15% | -0.14% | 0.26% | 0.20% | |
| GBP | 0.27% | 0.12% | 0.43% | -0.36% | -0.05% | 0.39% | 0.22% | |
| JPY | -0.16% | 0.10% | -0.43% | -0.31% | -0.56% | -0.18% | -0.27% | |
| CAD | 0.15% | -0.15% | 0.36% | 0.31% | -0.18% | 0.11% | 0.05% | |
| AUD | 0.38% | 0.14% | 0.05% | 0.56% | 0.18% | 0.42% | 0.35% | |
| NZD | 0.04% | -0.26% | -0.39% | 0.18% | -0.11% | -0.42% | 0.00% | |
| CHF | 0.10% | -0.20% | -0.22% | 0.27% | -0.05% | -0.35% | -0.01% |
The heat map shows percentage changes of major currencies against each other. The base currency is picked from the left column, while the quote currency is picked from the top row. For example, if you pick the New Zealand Dollar from the left column and move along the horizontal line to the US Dollar, the percentage change displayed in the box will represent NZD (base)/USD (quote).
![]()
Created
: 2025.03.24
![]()
Last updated
: 2025.03.24

FXStreet is a forex information website, delivering market analysis and news articles 24/7.
It features a number of articles contributed by well-known analysts, in addition to the ones by its editorial team.
Founded in 2000 by Francesc Riverola, a Spanish economist, it has grown to become a world-renowned information website.
We hope you find this article useful. Any comments or suggestions will be greatly appreciated.
We are also looking for writers with extensive experience in forex and crypto to join us.
please contact us at [email protected].
Disclaimer:![]()
All information and content provided on this website is provided for informational purposes only and is not intended to solicit any investment. Although all efforts are made in order to ensure that the information is correct, no guarantee is provided for the accuracy of any content on this website. Any decision made shall be the responsibility of the investor and Myforex does not take any responsibility whatsoever regarding the use of any information provided herein.
The content provided on this website belongs to Myforex and, where stated, the relevant licensors. All rights are reserved by Myforex and the relevant licensors, and no content of this website, whether in full or in part, shall be copied or displayed elsewhere without the explicit written permission of the relevant copyright holder. If you wish to use any part of the content provided on this website, please ensure that you contact Myforex.
Myforex uses cookies to improve the convenience and functionality of this website. This website may include cookies not only by us but also by third parties (advertisers, log analysts, etc.) for the purpose of tracking the activities of users. Cookie policy
