Created
: 2025.02.14


![]() 2025.02.14 02:11
2025.02.14 02:11
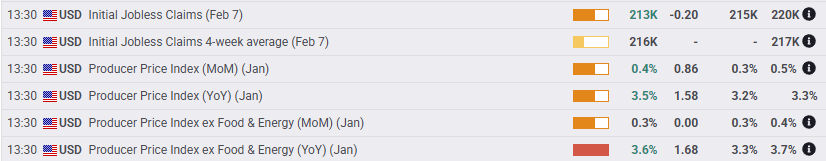
The Dow Jones Industrial Average (DJIA) found a little bit of room on the high side on Thursday, rising around 120 points and testing the 44,500 level. Equities were jarred by some steep upside revisions in Producer Price Index (PPI) inflation figures, but the overall print hit a decidedly softer tone than this week's Consumer Price Index (CPI) inflation figures. A spike in inflation fears has subsided, and rate markets are now pricing in revisions to when the Federal Reserve (Fed) is expected to deliver its next rate cut.
United States (US) President Donald Trump is expected to deliver his latest batch of tariff threats during the back half of the US market session. President Trump is slated to reveal details of his planned "reciprocal tariffs" on any country that has their own tariffs on US goods, but according to reporting from Washington DC, the can is getting preemptively kicked down the road with reciprocal tariffs not expected to come into effect for some months. Markets are getting used to brushing off trade war threats from Donald Trump, and this represents the fourth consecutive time that the Trump administration's threats of imposing steep import taxes on foreign goods have been announced and then delayed.
Core US PPI inflation clocked in at 3.6% YoY in January, well above the forecast of 3.3%. The previous period also saw a sharp revision higher to 3.7% from 3.5%, but the overall tick lower post-revision helped to assuage market fears of a resurgence of widespread inflation pressures. According to the CME's FedWatch tool, rate markets are now pricing in better-then-even odds that the Fed will deliver at least a 25 bps rate trim in September compared to Wednesday's forecast of December.
Despite the Dow's tepid average on Thursday, the overall equity board is holding a healthy stance with around two-thirds of the DJIA's listed securities testing higher on the day. Nvidia (NVDA) rallied 3.3% to $135 per share on stronger-than-expected microchip demand, giving the overall tech sector a leg up. Goldman Sachs (GS) led the bottom end of the board, falling a scant 0.8% to $644 per share.
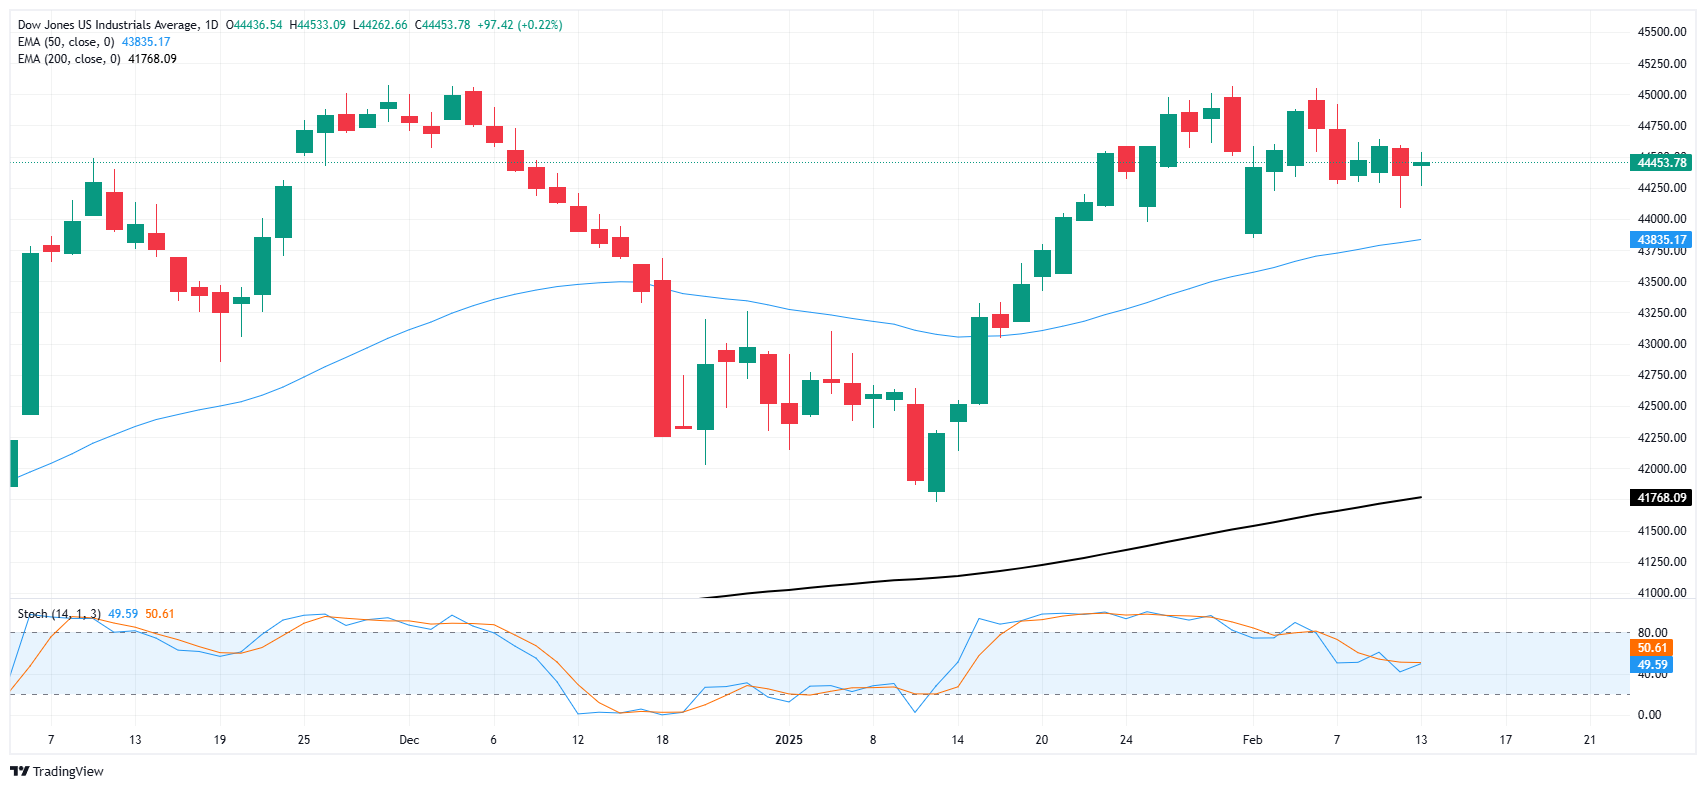
44,500 is becoming familiar territory for the Dow Jones. The mega-cap index has been churning within a choppy range between 45,000 and 44,000 since mid-January with bidders unable to find a foothold into fresh record highs, but short pressure is still unable to knock the DJIA lower.
Price action is still leaning in favor of buyers with bids churning north of the 50-day Exponential Moving Average (EMA) near 43,850. The gap between intraday prices and the long-run 200-day EMA near 41,800 has closed in recent weeks, but the Dow Jones is still trending well above its long-term average, outpacing the 200-day EMA since November of 2023. The Dow Jones has closed higher for all but three of the last 14 consecutive months.
The Dow Jones Industrial Average, one of the oldest stock market indices in the world, is compiled of the 30 most traded stocks in the US. The index is price-weighted rather than weighted by capitalization. It is calculated by summing the prices of the constituent stocks and dividing them by a factor, currently 0.152. The index was founded by Charles Dow, who also founded the Wall Street Journal. In later years it has been criticized for not being broadly representative enough because it only tracks 30 conglomerates, unlike broader indices such as the S&P 500.
Many different factors drive the Dow Jones Industrial Average (DJIA). The aggregate performance of the component companies revealed in quarterly company earnings reports is the main one. US and global macroeconomic data also contributes as it impacts on investor sentiment. The level of interest rates, set by the Federal Reserve (Fed), also influences the DJIA as it affects the cost of credit, on which many corporations are heavily reliant. Therefore, inflation can be a major driver as well as other metrics which impact the Fed decisions.
Dow Theory is a method for identifying the primary trend of the stock market developed by Charles Dow. A key step is to compare the direction of the Dow Jones Industrial Average (DJIA) and the Dow Jones Transportation Average (DJTA) and only follow trends where both are moving in the same direction. Volume is a confirmatory criteria. The theory uses elements of peak and trough analysis. Dow's theory posits three trend phases: accumulation, when smart money starts buying or selling; public participation, when the wider public joins in; and distribution, when the smart money exits.
There are a number of ways to trade the DJIA. One is to use ETFs which allow investors to trade the DJIA as a single security, rather than having to buy shares in all 30 constituent companies. A leading example is the SPDR Dow Jones Industrial Average ETF (DIA). DJIA futures contracts enable traders to speculate on the future value of the index and Options provide the right, but not the obligation, to buy or sell the index at a predetermined price in the future. Mutual funds enable investors to buy a share of a diversified portfolio of DJIA stocks thus providing exposure to the overall index.
![]()
Created
: 2025.02.14
![]()
Last updated
: 2025.02.14

FXStreet is a forex information website, delivering market analysis and news articles 24/7.
It features a number of articles contributed by well-known analysts, in addition to the ones by its editorial team.
Founded in 2000 by Francesc Riverola, a Spanish economist, it has grown to become a world-renowned information website.
We hope you find this article useful. Any comments or suggestions will be greatly appreciated.
We are also looking for writers with extensive experience in forex and crypto to join us.
please contact us at [email protected].
Disclaimer:![]()
All information and content provided on this website is provided for informational purposes only and is not intended to solicit any investment. Although all efforts are made in order to ensure that the information is correct, no guarantee is provided for the accuracy of any content on this website. Any decision made shall be the responsibility of the investor and Myforex does not take any responsibility whatsoever regarding the use of any information provided herein.
The content provided on this website belongs to Myforex and, where stated, the relevant licensors. All rights are reserved by Myforex and the relevant licensors, and no content of this website, whether in full or in part, shall be copied or displayed elsewhere without the explicit written permission of the relevant copyright holder. If you wish to use any part of the content provided on this website, please ensure that you contact Myforex.
Myforex uses cookies to improve the convenience and functionality of this website. This website may include cookies not only by us but also by third parties (advertisers, log analysts, etc.) for the purpose of tracking the activities of users. Cookie policy
