Created
: 2025.02.14


![]() 2025.02.14 00:19
2025.02.14 00:19
The Pound Sterling registered solid gains versus the Greenback on Thursday after GDP figures in the UK surprisingly beat estimates. Meanwhile, inflation in the US rose, and US job data shows that the labor market remains strong. The GBP/USD trades at 1.2510, up 0.53%.
Data saved the British Pound after the Q4 2024 preliminary reading showed the economy grew 0.1% QoQ, exceeding estimates for a -0.1 % contraction. On a yearly basis, GDP increased by 1.5%, which is above forecasts and the previous reading of 1%.
In the US, the US Bureau of Labor Statistics (BLS) revealed that the Producer Price Index (PPI) came at 0.4% MoM in January, above estimates of 0.3%, down from 0.5%. In year-over-year (YoY) data, the PPI remained unchanged at 3.5% but exceeded forecasts.
Core figures also came slightly hot, with monthly figures rising 0.3% as estimated. In the twelve months to January, the Core PPI increased by 3.6%, three-tenths above the 3.3% projection.
Other data showed that Initial Jobless Claims for the week ending February 8 rose by 213K, below estimates of 215K, and the February 1 reading of 220K.
Given the backdrop, the GBP/USD is trading in the green, though divergence amongst central banks favors further downside. After UK's GDP data, markets fully priced in the next cut in June and expect 55 basis points of easing by the Bank of England (BoE) towards the end of 2025.
Nevertheless, the BoE's Chief Economist Hue Pill said that he expects further rate cuts but urges caution as the disinflation process is not complete.
Meanwhile, the Fed adopted a cautious stance after the latest readings of inflation indicated the disinflation process stalled after five straight months of price increases. On Wednesday, the Fed Chair Jerome Powell said, "We are close but not there on inflation," adding, "We want to keep policy restrictive for now."
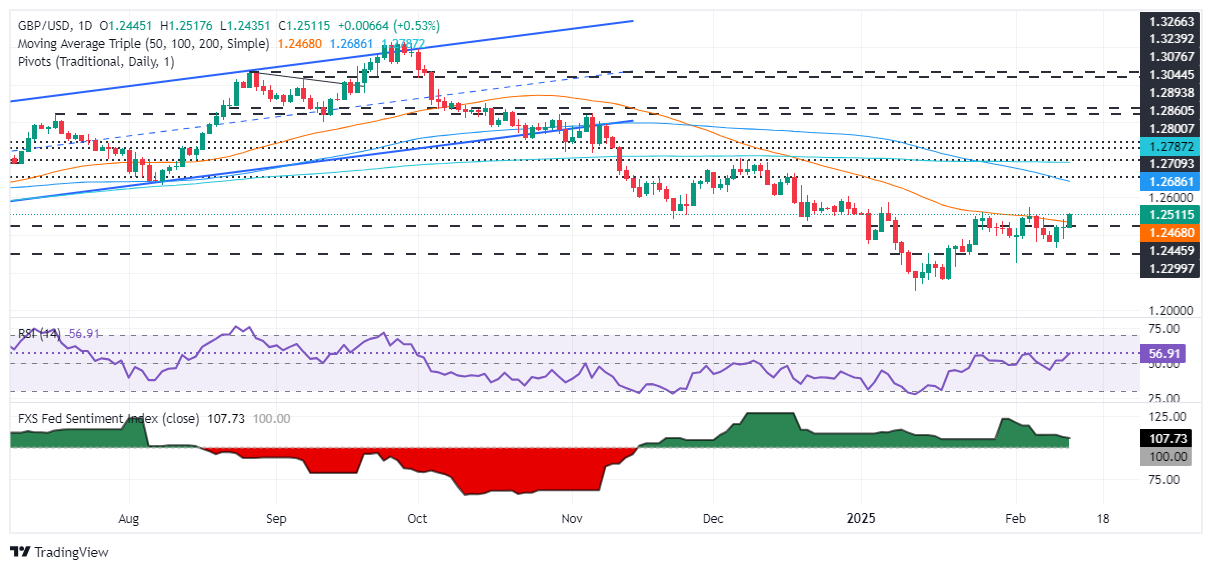
The GBP/USD downtrend remains intact as depicted by the daily chart. But if buyers reclaim the February 5 high of 1.2549, the bias shifts to neutral as the pair had achieved a higher-high, an indication of a trend shift. Further upside lies at 1.2600, and buyers may challenge the 100-day Simple Moving Average (SMA) at 1.2700.
Conversely, if GBP/USD drops below the 50-day SMA at 1.2473, sellers could push prices toward the 1.2400 mark.
The table below shows the percentage change of British Pound (GBP) against listed major currencies today. British Pound was the strongest against the US Dollar.
| USD | EUR | GBP | JPY | CAD | AUD | NZD | CHF | |
|---|---|---|---|---|---|---|---|---|
| USD | -0.39% | -0.53% | -0.54% | -0.41% | -0.07% | -0.08% | -0.75% | |
| EUR | 0.39% | -0.15% | -0.13% | -0.02% | 0.30% | 0.30% | -0.37% | |
| GBP | 0.53% | 0.15% | -0.02% | 0.12% | 0.46% | 0.44% | -0.23% | |
| JPY | 0.54% | 0.13% | 0.02% | 0.12% | 0.46% | 0.40% | -0.23% | |
| CAD | 0.41% | 0.02% | -0.12% | -0.12% | 0.35% | 0.32% | -0.35% | |
| AUD | 0.07% | -0.30% | -0.46% | -0.46% | -0.35% | -0.02% | -0.69% | |
| NZD | 0.08% | -0.30% | -0.44% | -0.40% | -0.32% | 0.02% | -0.67% | |
| CHF | 0.75% | 0.37% | 0.23% | 0.23% | 0.35% | 0.69% | 0.67% |
The heat map shows percentage changes of major currencies against each other. The base currency is picked from the left column, while the quote currency is picked from the top row. For example, if you pick the British Pound from the left column and move along the horizontal line to the US Dollar, the percentage change displayed in the box will represent GBP (base)/USD (quote).
![]()
Created
: 2025.02.14
![]()
Last updated
: 2025.02.14

FXStreet is a forex information website, delivering market analysis and news articles 24/7.
It features a number of articles contributed by well-known analysts, in addition to the ones by its editorial team.
Founded in 2000 by Francesc Riverola, a Spanish economist, it has grown to become a world-renowned information website.
We hope you find this article useful. Any comments or suggestions will be greatly appreciated.
We are also looking for writers with extensive experience in forex and crypto to join us.
please contact us at [email protected].
Disclaimer:![]()
All information and content provided on this website is provided for informational purposes only and is not intended to solicit any investment. Although all efforts are made in order to ensure that the information is correct, no guarantee is provided for the accuracy of any content on this website. Any decision made shall be the responsibility of the investor and Myforex does not take any responsibility whatsoever regarding the use of any information provided herein.
The content provided on this website belongs to Myforex and, where stated, the relevant licensors. All rights are reserved by Myforex and the relevant licensors, and no content of this website, whether in full or in part, shall be copied or displayed elsewhere without the explicit written permission of the relevant copyright holder. If you wish to use any part of the content provided on this website, please ensure that you contact Myforex.
Myforex uses cookies to improve the convenience and functionality of this website. This website may include cookies not only by us but also by third parties (advertisers, log analysts, etc.) for the purpose of tracking the activities of users. Cookie policy
