Created
: 2024.06.15


![]() 2024.06.15 04:00
2024.06.15 04:00
The Dow Jones Industrial Average (DJIA) climbed from an early low on Friday, but sill traded on the low side of Thursday's closing bids after getting knocked further back during the overnight session. Friday has been a slow grind as markets attempt to recover lost ground, but market confidence remains half-hearted after the University of Michigan's (UoM) Consumer Sentiment Index declined to a six-month low and missed a forecast recovery, while the UoM's Consumer Inflation Expectations ticked back into a recent high as spenders continue to remain despondent on future price growth.
The UoM Consumer Sentiment Index survey declined to 65.6 in June, entirely missing the forecast uptick to 72,0 and dropping from the previous 69.1, tumbling to a six-month low as consumers grow increasingly fearful about the state of the US economy. 5-year Consumer Inflation Expectations also ticked back up to a familiar high of 3.1% from the previous 3.0% as price growth continues to weigh on consumers' economic outlook.
The wind was taken out of market sails this week after the Federal Reserve's (Fed) latest Summary of Economic Projections (SEP) revealed that market hopes for multiple rate cuts continue to run well ahead of what the Fed expects in the future. The Fed's "dot plot" of median interest rate expectations shifted lower to only a single rate cut in 2024, down even further from the three projected in March.
Despite the cautious tone from the Fed, rate markets are still pricing in hopes for a September rate cut. According to the CME's FedWatch Tool, rate traders are pricing in nearly 70% odds of at least a quarter-point rate trim from the Fed at the September 18 rate decision.
Two-thirds of the Dow Jones' constituent securities are in the red on Friday as sentiment tilts lower. Salesforce Inc. (CRM) is recovering from near-term selling pressure, climbing 1.3% to $232.00 per share to lead the scant gainers on the Dow Jones for the day. On the low side, Boeing Co. (BA) has declined -2.06% on Friday, backsliding below $55.00 per share.
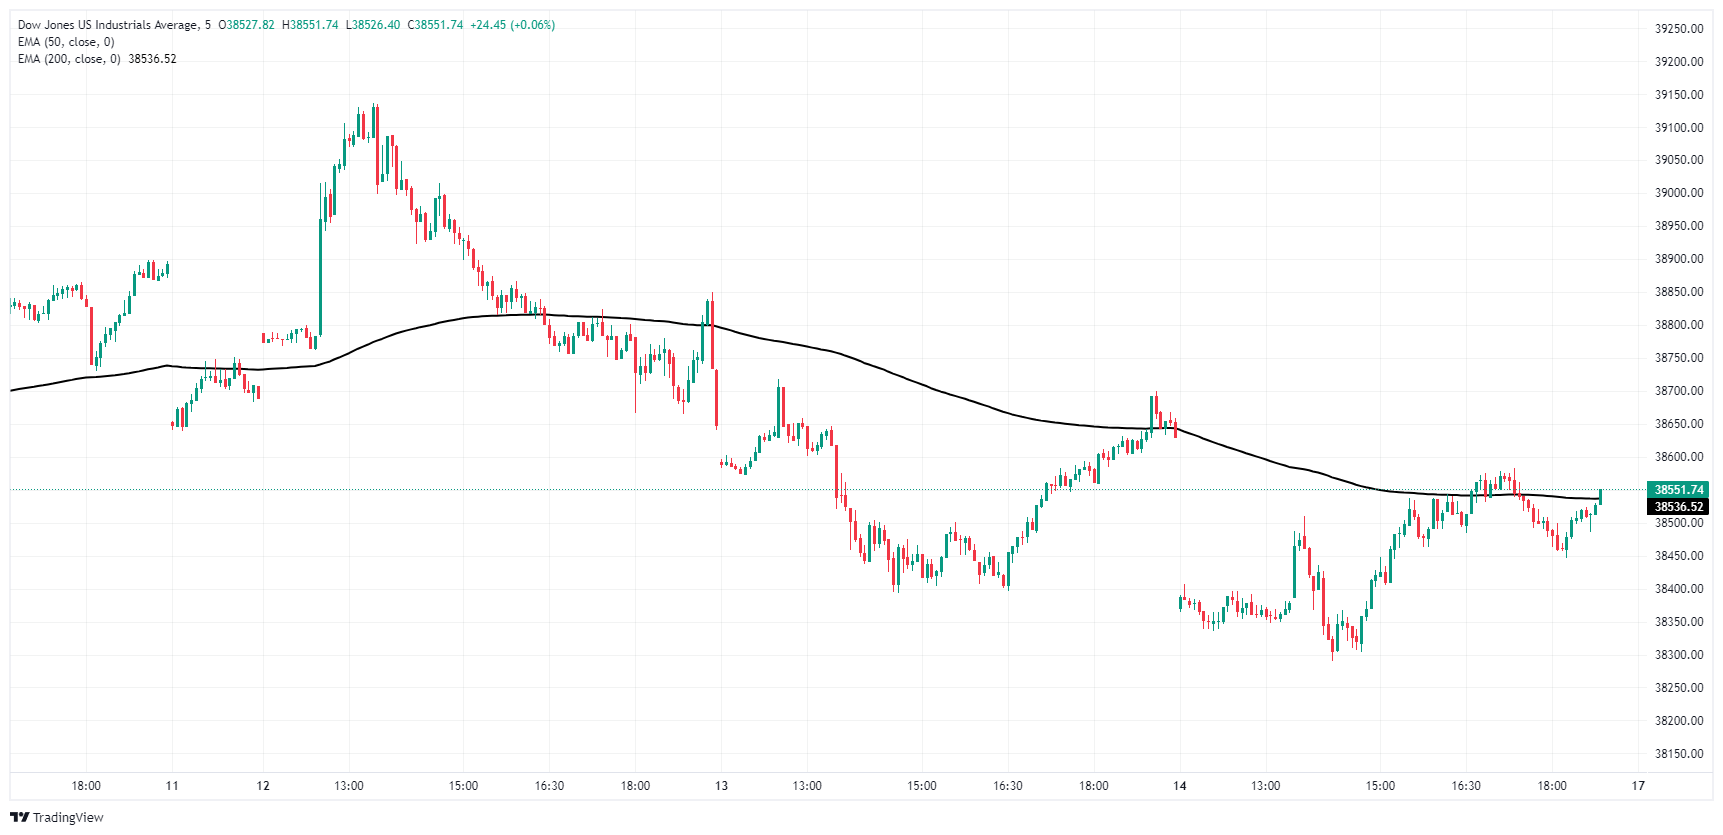
Friday's US session etched in a new weekly low in the Dow Jones, declining to 38,300.00 near the day's market open before making a meager recovery to chart territory just above 38,500.00. Bullish momentum still has the DJIA trading below Thursday's closing bids near 38,650.00, but an exhaustion play could easily drag the major equity index back towards the 38,000.00 handle.
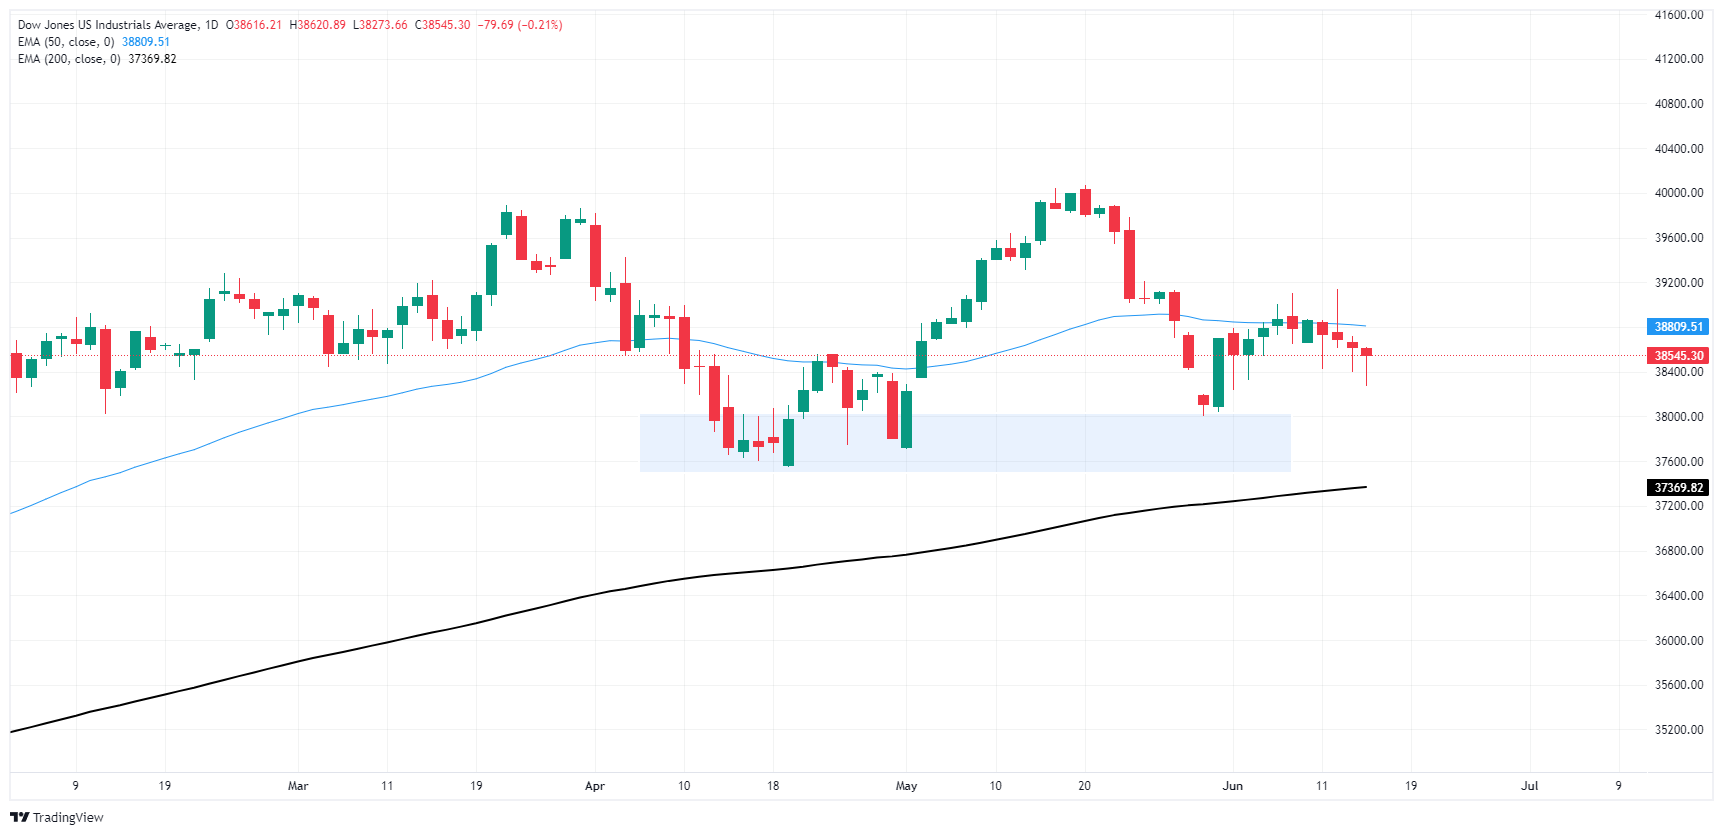
The Dow Jones Industrial Average is on pace to close slightly lower for a fourth consecutive day on Friday, and the index has continued waffle down from recent all-time highs above 40,000.00 set in May. The index continues to hold north of the 200-day Exponential Moving Average (EMA) at 37,369.62, and a demand zone is holding in place to catch any short side pushes below the 38,000.00 handle.
The Dow Jones Industrial Average, one of the oldest stock market indices in the world, is compiled of the 30 most traded stocks in the US. The index is price-weighted rather than weighted by capitalization. It is calculated by summing the prices of the constituent stocks and dividing them by a factor, currently 0.152. The index was founded by Charles Dow, who also founded the Wall Street Journal. In later years it has been criticized for not being broadly representative enough because it only tracks 30 conglomerates, unlike broader indices such as the S&P 500.
Many different factors drive the Dow Jones Industrial Average (DJIA). The aggregate performance of the component companies revealed in quarterly company earnings reports is the main one. US and global macroeconomic data also contributes as it impacts on investor sentiment. The level of interest rates, set by the Federal Reserve (Fed), also influences the DJIA as it affects the cost of credit, on which many corporations are heavily reliant. Therefore, inflation can be a major driver as well as other metrics which impact the Fed decisions.
Dow Theory is a method for identifying the primary trend of the stock market developed by Charles Dow. A key step is to compare the direction of the Dow Jones Industrial Average (DJIA) and the Dow Jones Transportation Average (DJTA) and only follow trends where both are moving in the same direction. Volume is a confirmatory criteria. The theory uses elements of peak and trough analysis. Dow's theory posits three trend phases: accumulation, when smart money starts buying or selling; public participation, when the wider public joins in; and distribution, when the smart money exits.
There are a number of ways to trade the DJIA. One is to use ETFs which allow investors to trade the DJIA as a single security, rather than having to buy shares in all 30 constituent companies. A leading example is the SPDR Dow Jones Industrial Average ETF (DIA). DJIA futures contracts enable traders to speculate on the future value of the index and Options provide the right, but not the obligation, to buy or sell the index at a predetermined price in the future. Mutual funds enable investors to buy a share of a diversified portfolio of DJIA stocks thus providing exposure to the overall index.
![]()
Created
: 2024.06.15
![]()
Last updated
: 2024.06.15

FXStreet is a forex information website, delivering market analysis and news articles 24/7.
It features a number of articles contributed by well-known analysts, in addition to the ones by its editorial team.
Founded in 2000 by Francesc Riverola, a Spanish economist, it has grown to become a world-renowned information website.
We hope you find this article useful. Any comments or suggestions will be greatly appreciated.
We are also looking for writers with extensive experience in forex and crypto to join us.
please contact us at [email protected].
Disclaimer:![]()
All information and content provided on this website is provided for informational purposes only and is not intended to solicit any investment. Although all efforts are made in order to ensure that the information is correct, no guarantee is provided for the accuracy of any content on this website. Any decision made shall be the responsibility of the investor and Myforex does not take any responsibility whatsoever regarding the use of any information provided herein.
The content provided on this website belongs to Myforex and, where stated, the relevant licensors. All rights are reserved by Myforex and the relevant licensors, and no content of this website, whether in full or in part, shall be copied or displayed elsewhere without the explicit written permission of the relevant copyright holder. If you wish to use any part of the content provided on this website, please ensure that you contact Myforex.
Myforex uses cookies to improve the convenience and functionality of this website. This website may include cookies not only by us but also by third parties (advertisers, log analysts, etc.) for the purpose of tracking the activities of users. Cookie policy
