Created
: 2024.06.22


![]() 2024.06.22 05:27
2024.06.22 05:27
West Texas Intermediate (WTI) US Crude Oil hit a fresh high for the week early Friday before slumping back into negative territory for the day after the Energy Information Administration (EIA) noted that US Crude Oil production remains near all-time peaks and a larger-than-expected buildup in Natural Gas reserves.
The EIA reported a 71 billion cubic feet (Bcf) increase in the amount of available working natural gas in storage, bringing US reserves to a multi-month high of 3,045 Bcf for the week ended June 14. The previous week's increase of 74 Bcf was expected to a steeper drop in buildup to only 69 Bcf.
With natural gas reserves filling up ahead of peak summertime cooling demand, Crude Oil is less likely to see meaningful increases in demand, trimming hopes of a steeper drawdown during the summer.
US Purchasing Managers Index (PMI) figures for June also beat the street on Friday, pressing down on broad-market hopes for rate cuts. With the Federal Reserve (Fed) unlikely to get forced into an accelerated pace of rate cuts in 2024, Crude Oil markets are second-guessing near-term bullishness as investors lean deeply into rate trim hopes to ease lending and financing costs.
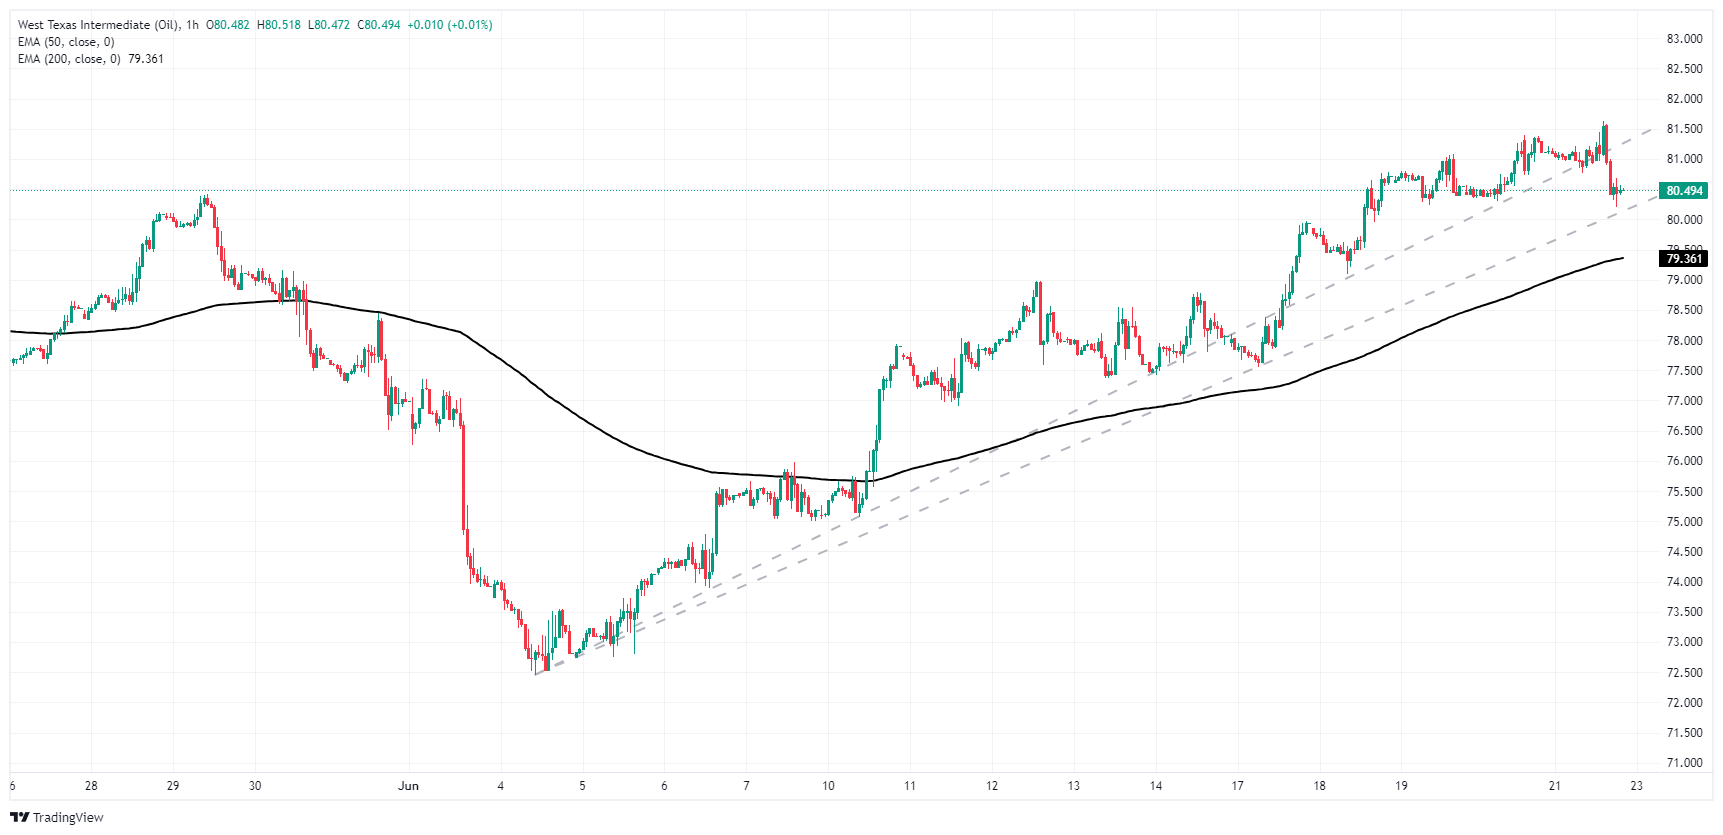
Hesitating bulls have crimped topside momentum in WTI on Friday, dragging intraday price action back into range of near-term rising trendlines. Firmer technical support is sitting at the 200-hour Exponential Moving Average (EMA) at $79.35. Despite a hesitation in the second-half of Friday's US market session, US Crude Oil managed to etch out a fresh seven-week high above $81.60 before settling lower.
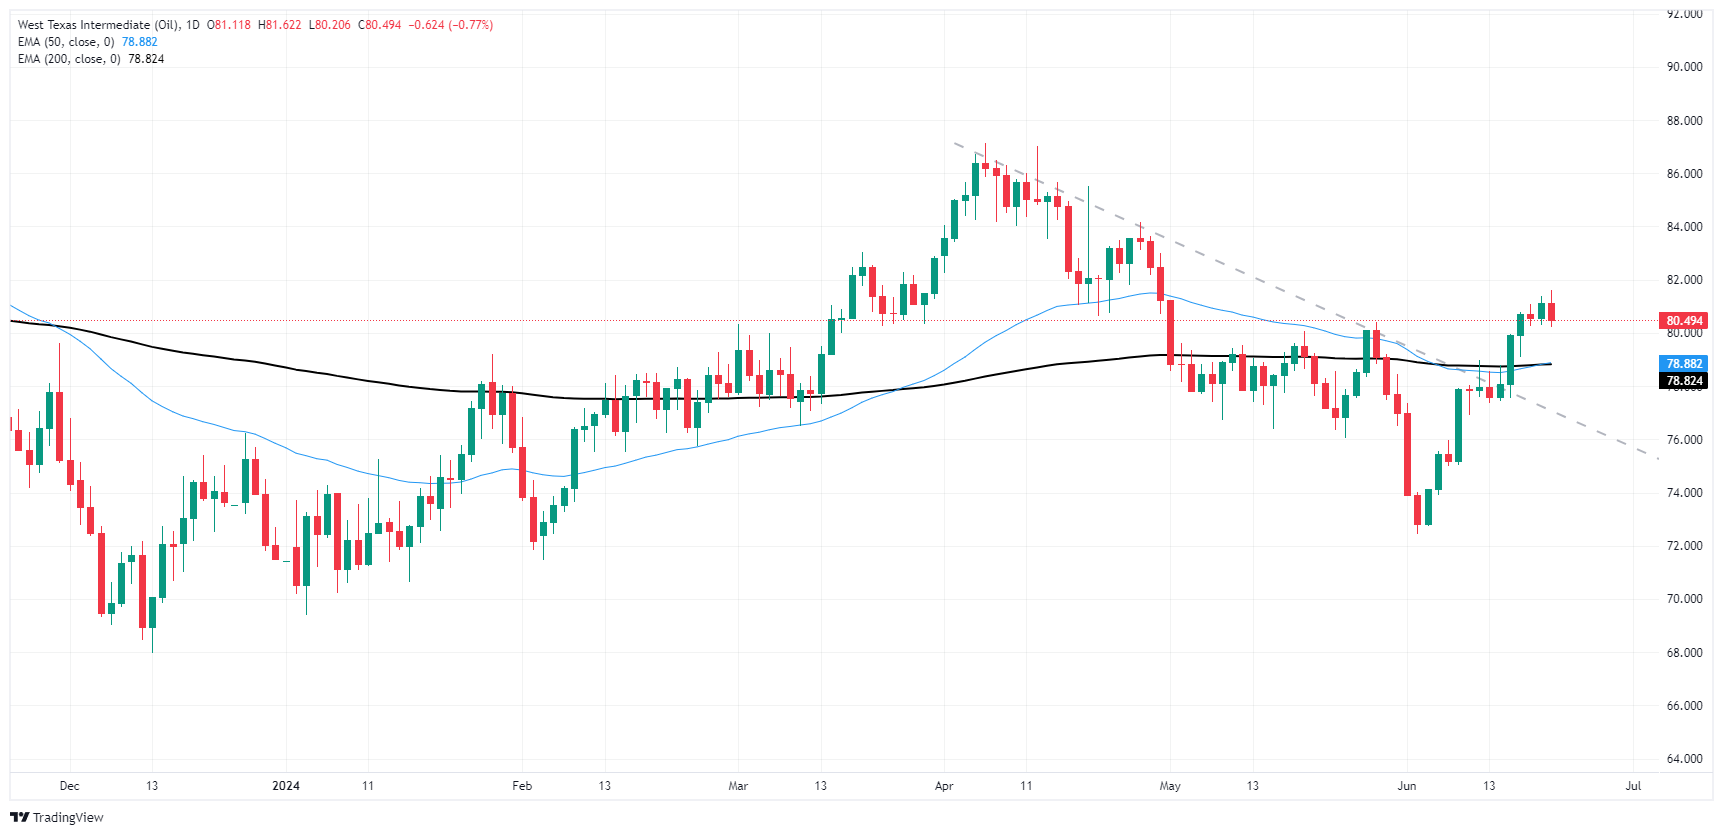
Daily candlesticks are beginning to show signs of exhaustion as WTI's technical recovery above the 200-day EMA at $78.87 begins to run out of steam. Barring a resurgence in firm bidding, WTI could be primed for a tumble back to the last swing low near $72.50.
WTI Oil is a type of Crude Oil sold on international markets. The WTI stands for West Texas Intermediate, one of three major types including Brent and Dubai Crude. WTI is also referred to as "light" and "sweet" because of its relatively low gravity and sulfur content respectively. It is considered a high quality Oil that is easily refined. It is sourced in the United States and distributed via the Cushing hub, which is considered "The Pipeline Crossroads of the World". It is a benchmark for the Oil market and WTI price is frequently quoted in the media.
Like all assets, supply and demand are the key drivers of WTI Oil price. As such, global growth can be a driver of increased demand and vice versa for weak global growth. Political instability, wars, and sanctions can disrupt supply and impact prices. The decisions of OPEC, a group of major Oil-producing countries, is another key driver of price. The value of the US Dollar influences the price of WTI Crude Oil, since Oil is predominantly traded in US Dollars, thus a weaker US Dollar can make Oil more affordable and vice versa.
The weekly Oil inventory reports published by the American Petroleum Institute (API) and the Energy Information Agency (EIA) impact the price of WTI Oil. Changes in inventories reflect fluctuating supply and demand. If the data shows a drop in inventories it can indicate increased demand, pushing up Oil price. Higher inventories can reflect increased supply, pushing down prices. API's report is published every Tuesday and EIA's the day after. Their results are usually similar, falling within 1% of each other 75% of the time. The EIA data is considered more reliable, since it is a government agency.
OPEC (Organization of the Petroleum Exporting Countries) is a group of 13 Oil-producing nations who collectively decide production quotas for member countries at twice-yearly meetings. Their decisions often impact WTI Oil prices. When OPEC decides to lower quotas, it can tighten supply, pushing up Oil prices. When OPEC increases production, it has the opposite effect. OPEC+ refers to an expanded group that includes ten extra non-OPEC members, the most notable of which is Russia.
![]()
Created
: 2024.06.22
![]()
Last updated
: 2024.06.22

FXStreet is a forex information website, delivering market analysis and news articles 24/7.
It features a number of articles contributed by well-known analysts, in addition to the ones by its editorial team.
Founded in 2000 by Francesc Riverola, a Spanish economist, it has grown to become a world-renowned information website.
We hope you find this article useful. Any comments or suggestions will be greatly appreciated.
We are also looking for writers with extensive experience in forex and crypto to join us.
please contact us at [email protected].
Disclaimer:![]()
All information and content provided on this website is provided for informational purposes only and is not intended to solicit any investment. Although all efforts are made in order to ensure that the information is correct, no guarantee is provided for the accuracy of any content on this website. Any decision made shall be the responsibility of the investor and Myforex does not take any responsibility whatsoever regarding the use of any information provided herein.
The content provided on this website belongs to Myforex and, where stated, the relevant licensors. All rights are reserved by Myforex and the relevant licensors, and no content of this website, whether in full or in part, shall be copied or displayed elsewhere without the explicit written permission of the relevant copyright holder. If you wish to use any part of the content provided on this website, please ensure that you contact Myforex.
Myforex uses cookies to improve the convenience and functionality of this website. This website may include cookies not only by us but also by third parties (advertisers, log analysts, etc.) for the purpose of tracking the activities of users. Cookie policy
