Created
: 2024.04.26


![]() 2024.04.26 20:30
2024.04.26 20:30
Natural Gas (XNG/USD) prices are holding ground above $2.00 on Friday after a brief dip earlier this week. Gas prices are quickly recovering as mainland Europe is gearing up for the next heating season, with traders starting to negotiate contracts in order to refuel ahead of next winter. Even though European Gas reserves are still at 61%, traders are issuing concerns that the volume of pre-agreed contracts is too little to get strategic reserves back to their near-full levels seen last September, which means more short-term and more expensive handling could occur.
Meanwhile, the US Dollar Index (DXY), which tracks the US Dollar's value against six major currencies, falls further to the 105.50 region. The devaluation of the Greenback comes after the preliminary US Purchasing Managers Index (PMI) for April, for both manufacturing and services sectors, did not support US exceptionalism further. Thursday's US Gross Domestic Product for the first quarter release even looks to show the US economy is in stagflation, although that still needs to be confirmed by more numbers and data like the Personal Consumption Expenditure (PCE) release on Friday.
Natural Gas is trading at $2.06 per MMBtu at the time of writing.
Natural Gas could be entering in a rather steady uptrend, with the demand side from mainland Europe and the UK starting to take in deliveries for restocking ahead of this year's fall and winter. Subsequently, continuous demand will be present during the spring and summer periods. Meanwhile, on the supply side, Norway and the US have had substantial delivery issues due to unforeseen maintenance and outages in certain LNG facilities. Any further disruptions could trigger a shot higher, with Gas prices heading to $2.50 over the summer.
On the upside, the blue line at $2.11, the 2023 low, and the 100-day Simple Moving Average (SMA) at $2.10 are acting as a resistance. Further up, the next level to watch is the January 25 high at $2.33.
On the other side, the $2.00 handle has worked as nearby support for now. Further down, a trifecta of support is formed at $1.88, with the ascending and descending trend lines crossing and the 55-day SMA. Should that level break, expect a quick downward movement to the year-to-date low at $1.60.
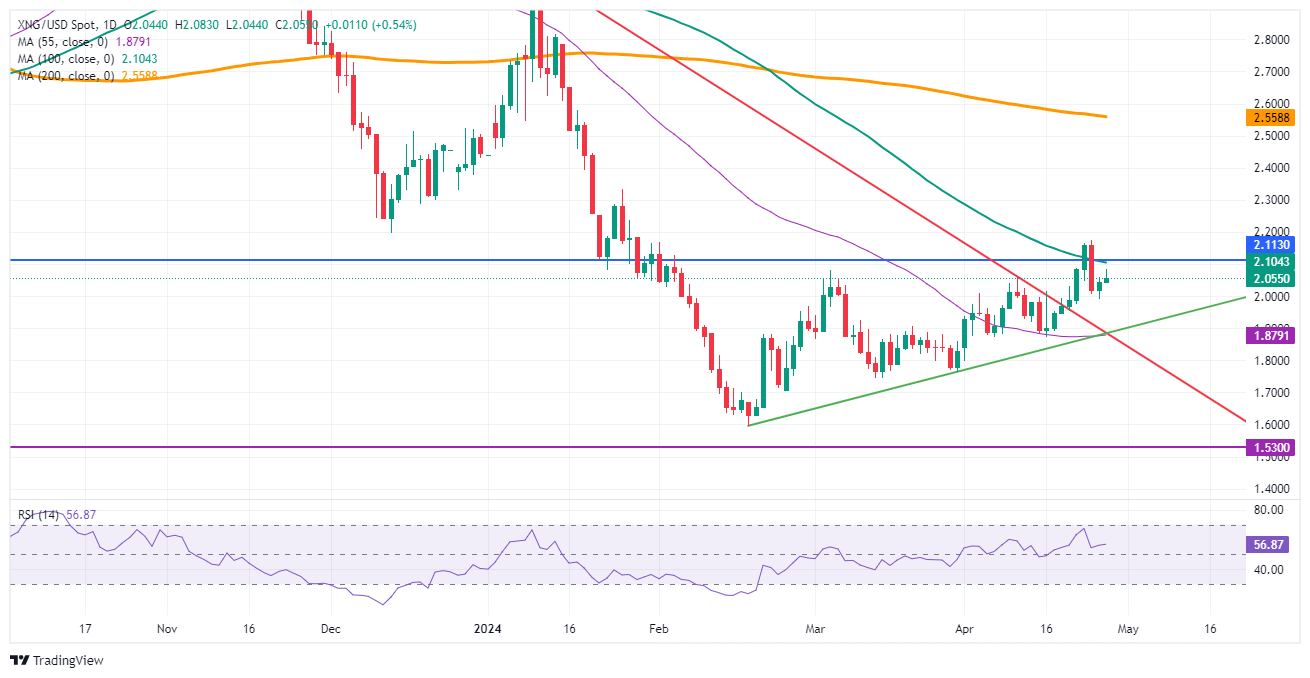
Natural Gas: Daily Chart
Supply and demand dynamics are a key factor influencing Natural Gas prices, and are themselves influenced by global economic growth, industrial activity, population growth, production levels, and inventories. The weather impacts Natural Gas prices because more Gas is used during cold winters and hot summers for heating and cooling. Competition from other energy sources impacts prices as consumers may switch to cheaper sources. Geopolitical events are factors as exemplified by the war in Ukraine. Government policies relating to extraction, transportation, and environmental issues also impact prices.
The main economic release influencing Natural Gas prices is the weekly inventory bulletin from the Energy Information Administration (EIA), a US government agency that produces US gas market data. The EIA Gas bulletin usually comes out on Thursday at 14:30 GMT, a day after the EIA publishes its weekly Oil bulletin. Economic data from large consumers of Natural Gas can impact supply and demand, the largest of which include China, Germany and Japan. Natural Gas is primarily priced and traded in US Dollars, thus economic releases impacting the US Dollar are also factors.
The US Dollar is the world's reserve currency and most commodities, including Natural Gas are priced and traded on international markets in US Dollars. As such, the value of the US Dollar is a factor in the price of Natural Gas, because if the Dollar strengthens it means less Dollars are required to buy the same volume of Gas (the price falls), and vice versa if USD strengthens.
![]()
Created
: 2024.04.26
![]()
Last updated
: 2024.04.26

FXStreet is a forex information website, delivering market analysis and news articles 24/7.
It features a number of articles contributed by well-known analysts, in addition to the ones by its editorial team.
Founded in 2000 by Francesc Riverola, a Spanish economist, it has grown to become a world-renowned information website.
We hope you find this article useful. Any comments or suggestions will be greatly appreciated.
We are also looking for writers with extensive experience in forex and crypto to join us.
please contact us at [email protected].
Disclaimer:![]()
All information and content provided on this website is provided for informational purposes only and is not intended to solicit any investment. Although all efforts are made in order to ensure that the information is correct, no guarantee is provided for the accuracy of any content on this website. Any decision made shall be the responsibility of the investor and Myforex does not take any responsibility whatsoever regarding the use of any information provided herein.
The content provided on this website belongs to Myforex and, where stated, the relevant licensors. All rights are reserved by Myforex and the relevant licensors, and no content of this website, whether in full or in part, shall be copied or displayed elsewhere without the explicit written permission of the relevant copyright holder. If you wish to use any part of the content provided on this website, please ensure that you contact Myforex.
Myforex uses cookies to improve the convenience and functionality of this website. This website may include cookies not only by us but also by third parties (advertisers, log analysts, etc.) for the purpose of tracking the activities of users. Cookie policy
