Created
: 2024.05.06


![]() 2024.05.06 22:37
2024.05.06 22:37
NZD/USD is trading in the 0.6020s after having risen for the fourth day in a row, on Monday. The pair is encountering significant resistance from the 50-day Simple Moving Average (SMA) and a major trendline. NZD/USD has reached a crossroads where it could either continue higher or revert to the bearish sentiment that has characterized the year so far.
To extend the bullish short-term gains NZD/USD has clocked up since the pivotal April 19 low, the pair will need to make a decisive break above the confluence of resistance it is bumping up against - if not, this could be an inflection point where the price turns and starts going lower again, in line with the medium-term bearish trend.
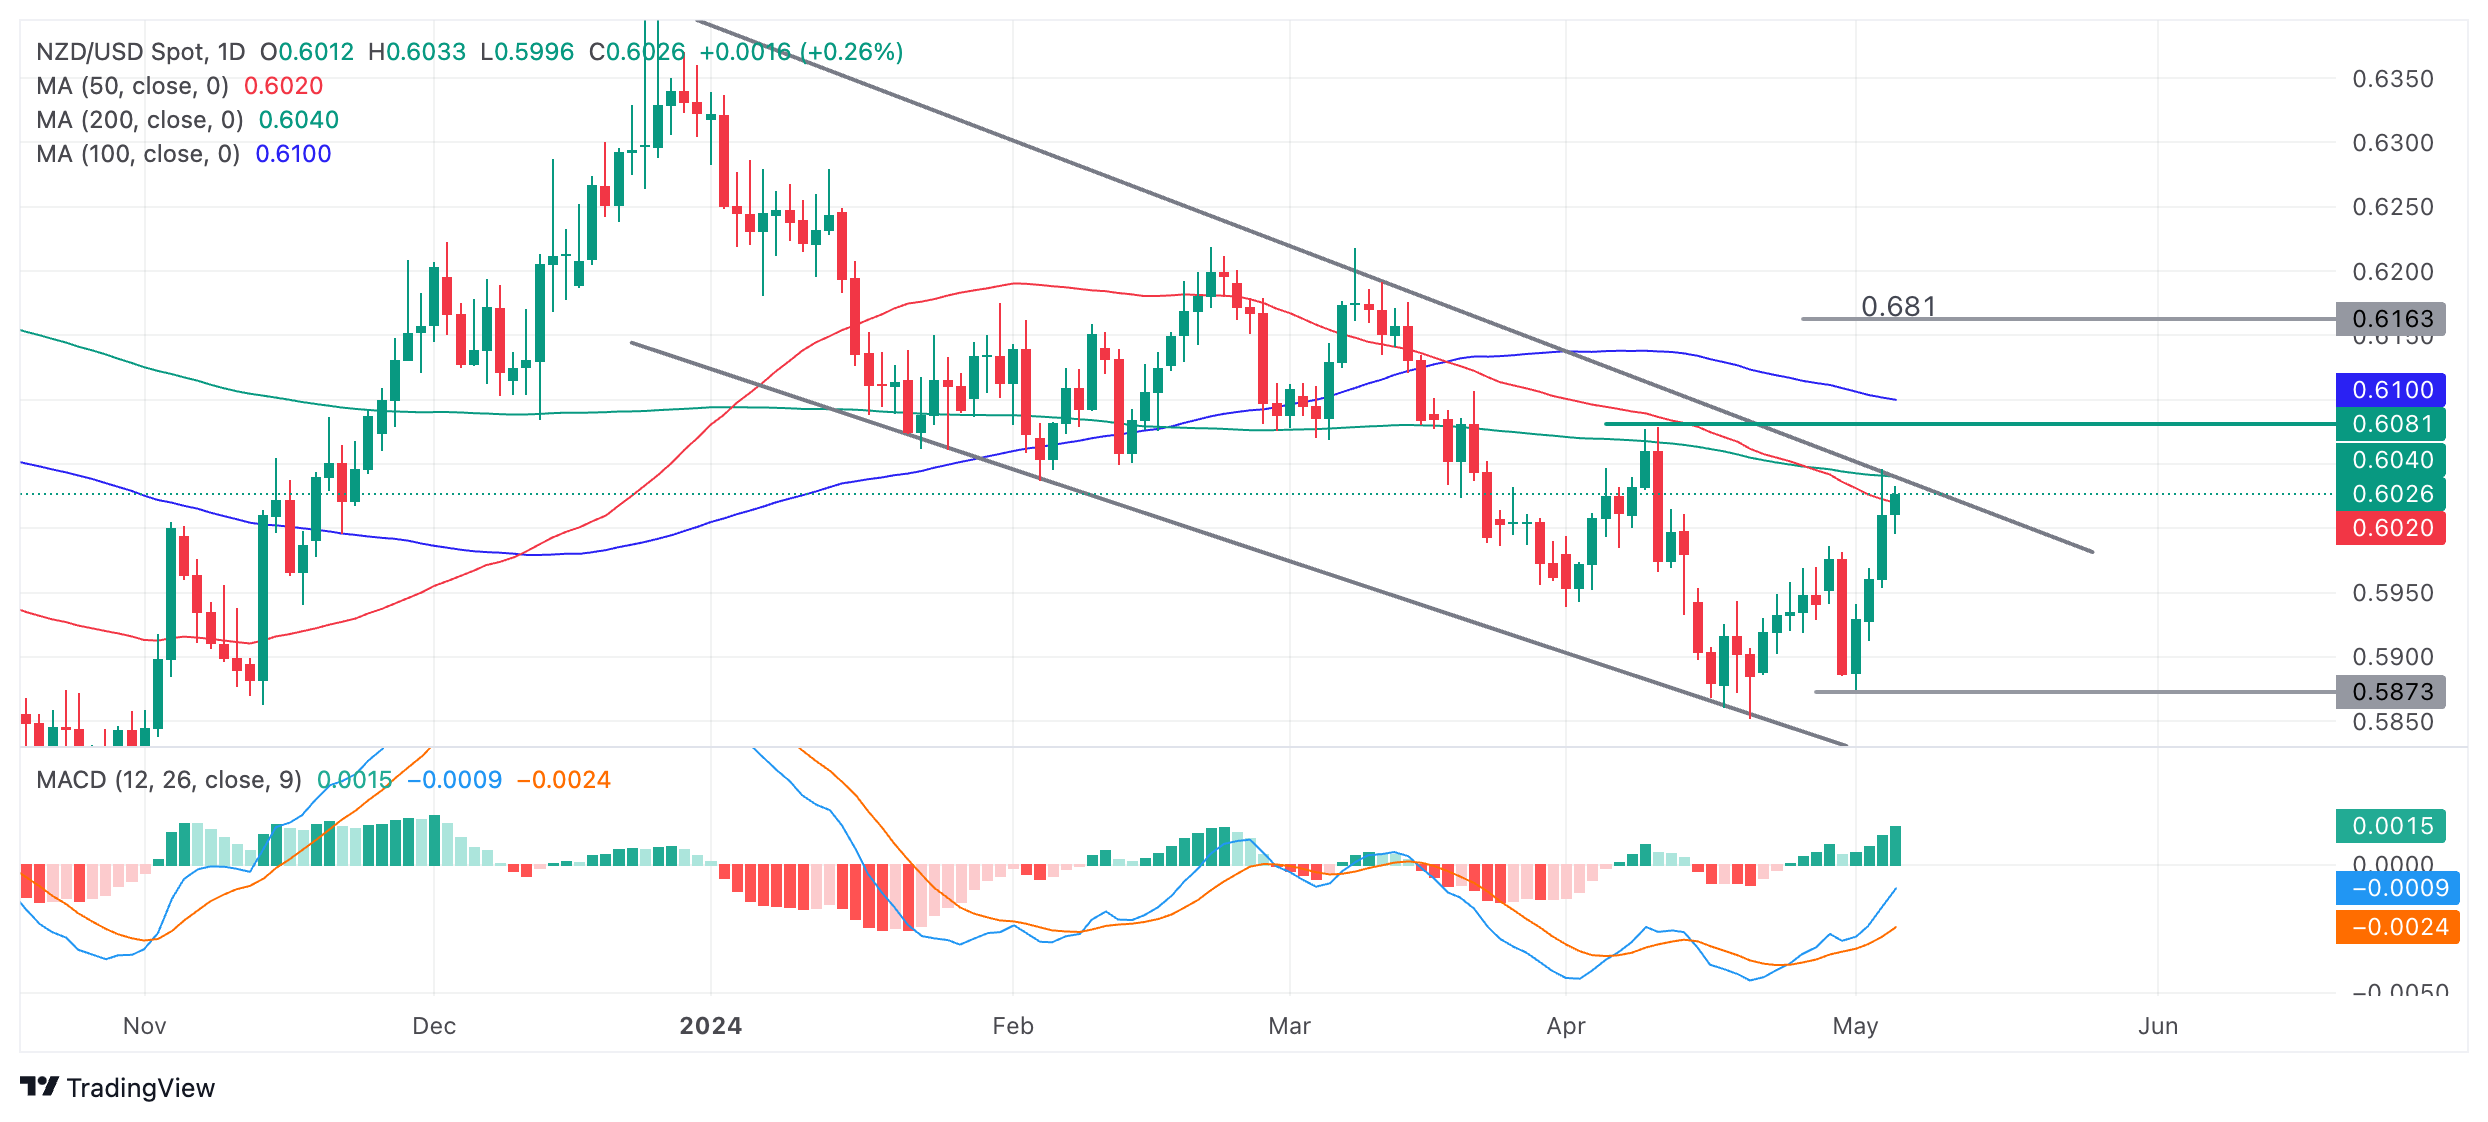
NZD/USD is testing resistance from the 50-day, 200-day SMA and the trendline for the down move since the start of 2024. Unless it breaks out it will probably continue back down to the 0.5870 lows, possibly even lower.
However, there are no signs yet on the chart that indicates the start of a new down-leg.
Given the strength of the move up since the April 19 lows and the strong accompanying bullish momentum reflected in the Moving Average Convergence Divergence (MACD) there is a chance a breakout from the channel could follow on. Further, the MACD has formed a bullish double bottom pattern during April which is a sign of a change in trend in the underlying price as well as the MACD.
A decisive break above the trendline would be required to indicate NZD/USD was going higher. Such a breakout would be signaled by a long bullish green daily candle breaking clearly above the trendline and closing near the high of the day. Alternatively three green candles in a row that broke clearly above could also indicate a decisive breakout. Price trading above the top of the last swing high at 0.6081 would also be a bullish sign.
Such a break, if it were to develop, would signal significant upside. The usual way to estimate how far a move will go following a trendline break is to take the move that directly preceded it and extrapolate that higher. For a conservative estimate the 0.681 Fibonacci ratio can be used. This gives a conservative target of 0.6163 and a full estimate of 0.6213.
![]()
Created
: 2024.05.06
![]()
Last updated
: 2024.05.06

FXStreet is a forex information website, delivering market analysis and news articles 24/7.
It features a number of articles contributed by well-known analysts, in addition to the ones by its editorial team.
Founded in 2000 by Francesc Riverola, a Spanish economist, it has grown to become a world-renowned information website.
We hope you find this article useful. Any comments or suggestions will be greatly appreciated.
We are also looking for writers with extensive experience in forex and crypto to join us.
please contact us at [email protected].
Disclaimer:![]()
All information and content provided on this website is provided for informational purposes only and is not intended to solicit any investment. Although all efforts are made in order to ensure that the information is correct, no guarantee is provided for the accuracy of any content on this website. Any decision made shall be the responsibility of the investor and Myforex does not take any responsibility whatsoever regarding the use of any information provided herein.
The content provided on this website belongs to Myforex and, where stated, the relevant licensors. All rights are reserved by Myforex and the relevant licensors, and no content of this website, whether in full or in part, shall be copied or displayed elsewhere without the explicit written permission of the relevant copyright holder. If you wish to use any part of the content provided on this website, please ensure that you contact Myforex.
Myforex uses cookies to improve the convenience and functionality of this website. This website may include cookies not only by us but also by third parties (advertisers, log analysts, etc.) for the purpose of tracking the activities of users. Cookie policy
