Created
: 2024.04.17


![]() 2024.04.17 01:52
2024.04.17 01:52
The Dow Jones Industrial Average (DJIA) is going through a moderate advance in a cautious session on Tuesday morning. The high US Treasury yields and market concerns about the volatile situation in the Middle East have offset the positive impact of quarterly earnings results.
United Health and Morgan Stanley have reported better-than-expected quarterly earnings on Tuesday, offsetting the disappointing results by Bank of America (BAC) and Johnson & Johnson (JNJ).
Traders, however, remain wary of risk as Israel ponders its response to Iran's missile attack as the international community pressures its leaders to show restraint.
In this scenario, the main Wall Street indices are mixed, with the Dow Jones 0.4% higher to 37,897, while the S&P 500 and the NASDAQ are practically flat at 5,062 and 15,890, respectively.
The Health sector is leading gains for the second consecutive day with a 0.4% advance. That sector's gains are followed by Technology, 0.3% higher. The Energy sector is the worst performer with a 1.08% decline, and next is the Utilities sector, down 0.95%.
UnitedHealth (UNH) is outperforming with a 6.2% rally to $473.43 after its quarterly report beat expectations. Salesforce (CRM) rises 2% to $278.45. On the negative side, Johnson & Johnson drops 2% to $144.67, and Apple (AAPL) loses another 1.7% to $169.78.
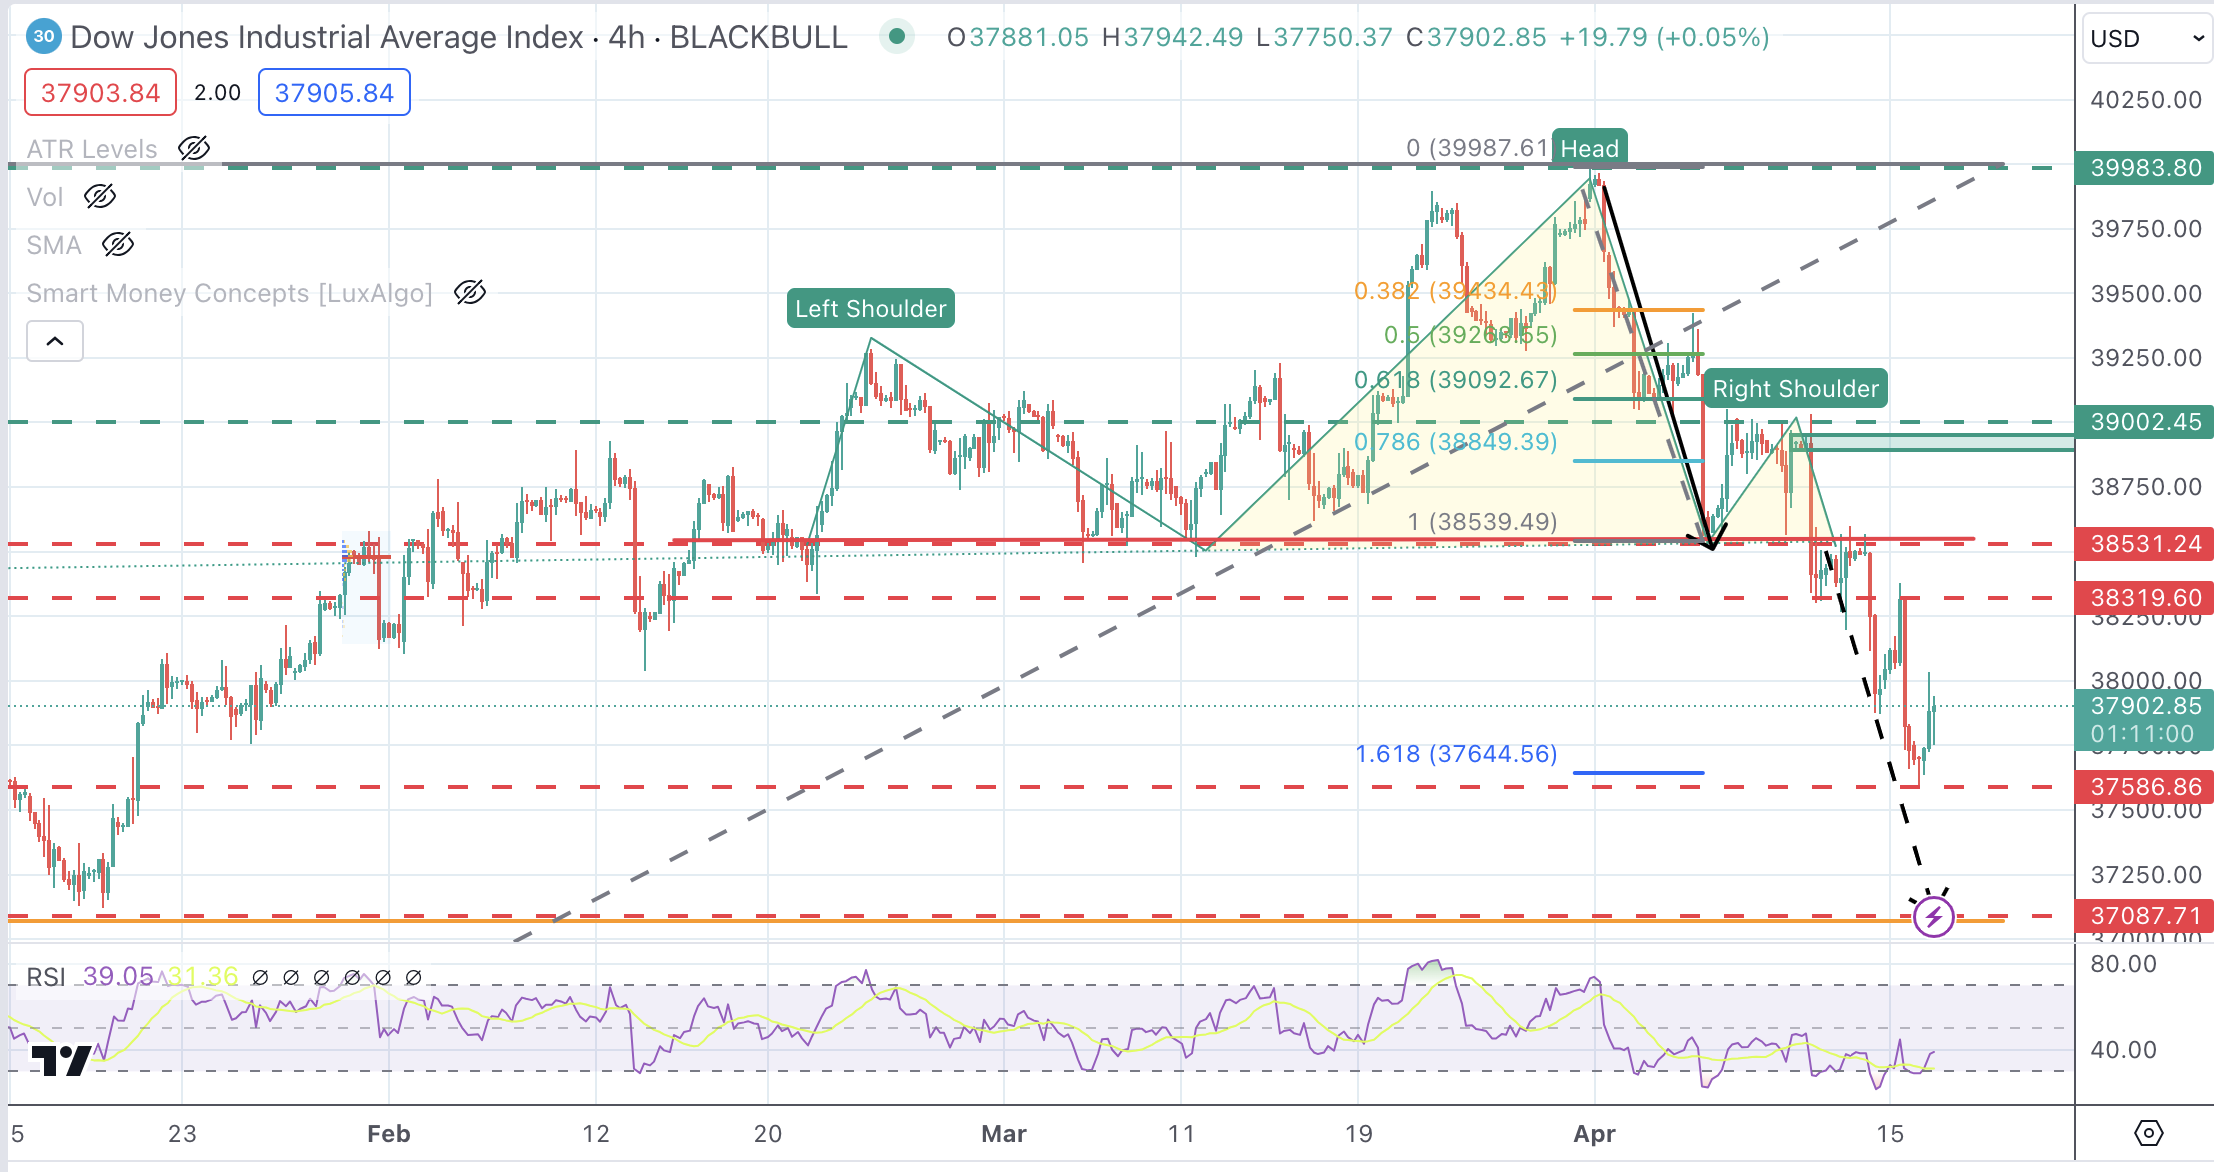
The DJIA index is trimming some loose ends on Tuesday although the overall picture remains bearish. The move below 38,560 has activated a Head & Shoulders pattern that points toward a sharper decline.
Immediate support is 37,586, followed by the measured target of the H&S pattern, which meets the mid-January low and 38.6% Fibonacci retracement at 37,087. A bullish reaction might find resistance at the 38,531 previous support ahead of the 39,000 region (order block).
The Dow Jones Industrial Average, one of the oldest stock market indices in the world, is compiled of the 30 most traded stocks in the US. The index is price-weighted rather than weighted by capitalization. It is calculated by summing the prices of the constituent stocks and dividing them by a factor, currently 0.152. The index was founded by Charles Dow, who also founded the Wall Street Journal. In later years it has been criticized for not being broadly representative enough because it only tracks 30 conglomerates, unlike broader indices such as the S&P 500.
Many different factors drive the Dow Jones Industrial Average (DJIA). The aggregate performance of the component companies revealed in quarterly company earnings reports is the main one. US and global macroeconomic data also contributes as it impacts on investor sentiment. The level of interest rates, set by the Federal Reserve (Fed), also influences the DJIA as it affects the cost of credit, on which many corporations are heavily reliant. Therefore, inflation can be a major driver as well as other metrics which impact the Fed decisions.
Dow Theory is a method for identifying the primary trend of the stock market developed by Charles Dow. A key step is to compare the direction of the Dow Jones Industrial Average (DJIA) and the Dow Jones Transportation Average (DJTA) and only follow trends where both are moving in the same direction. Volume is a confirmatory criteria. The theory uses elements of peak and trough analysis. Dow's theory posits three trend phases: accumulation, when smart money starts buying or selling; public participation, when the wider public joins in; and distribution, when the smart money exits.
There are a number of ways to trade the DJIA. One is to use ETFs which allow investors to trade the DJIA as a single security, rather than having to buy shares in all 30 constituent companies. A leading example is the SPDR Dow Jones Industrial Average ETF (DIA). DJIA futures contracts enable traders to speculate on the future value of the index and Options provide the right, but not the obligation, to buy or sell the index at a predetermined price in the future. Mutual funds enable investors to buy a share of a diversified portfolio of DJIA stocks thus providing exposure to the overall index.
![]()
Created
: 2024.04.17
![]()
Last updated
: 2024.04.17

FXStreet is a forex information website, delivering market analysis and news articles 24/7.
It features a number of articles contributed by well-known analysts, in addition to the ones by its editorial team.
Founded in 2000 by Francesc Riverola, a Spanish economist, it has grown to become a world-renowned information website.
We hope you find this article useful. Any comments or suggestions will be greatly appreciated.
We are also looking for writers with extensive experience in forex and crypto to join us.
please contact us at [email protected].
Disclaimer:![]()
All information and content provided on this website is provided for informational purposes only and is not intended to solicit any investment. Although all efforts are made in order to ensure that the information is correct, no guarantee is provided for the accuracy of any content on this website. Any decision made shall be the responsibility of the investor and Myforex does not take any responsibility whatsoever regarding the use of any information provided herein.
The content provided on this website belongs to Myforex and, where stated, the relevant licensors. All rights are reserved by Myforex and the relevant licensors, and no content of this website, whether in full or in part, shall be copied or displayed elsewhere without the explicit written permission of the relevant copyright holder. If you wish to use any part of the content provided on this website, please ensure that you contact Myforex.
Myforex uses cookies to improve the convenience and functionality of this website. This website may include cookies not only by us but also by third parties (advertisers, log analysts, etc.) for the purpose of tracking the activities of users. Cookie policy
