Created
: 2024.04.24


![]() 2024.04.24 02:30
2024.04.24 02:30
The Dow Jones Industrial Average (DJIA) climbed on Tuesday after US Purchasing Managers Index (PMI) figures softened unexpectedly, bringing broad-market hopes for an earlier-than-expected rate cut from the US Federal Reserve (Fed) back to the forefront.
The US Manufacturing PMI slid to a four-month low of 49.9 on Tuesday, slipping back from the previous 51.9. The Services PMI also declined, falling to 50.9 from 51.7. Both PMI components were expected to tick upwards to 52.0. With a softening PMI outlook, investors will watch US Gross Domestic Product (GDP) figures slated for Thursday.
The Fed's favored method of gauging inflation, the Personal Consumption Expenditure (PCE) Price Index, will print on Friday to round out the trading week. Equities will look for further signs of slowing in the US domestic economy to gauge the likelihood of the Fed getting pushed into a rate cut cycle than currently expected.
US GDP is currently forecast to cool off to 2.5% for the first quarter on an annualized basis, while Friday's Core PCE Price Index is expected to hold steady at 0.3% MoM in March.
Despite broad-market gains for US equities, the Dow Jones remains tepid compared to the other mega indexes, with the DJIA gaining around seven-tenths of a percent. Of the 30 securities that comprise the Dow Jones index, nearly a third of them remain in the red on Tuesday, with Walmart Inc. (WMT) leading the losers. WMT is down around 2.5% percent on the day, trading near $58.60 per share.
Verizon Communications Inc. (VZ) is recovering from Monday's downside, climbing nearly 3.5% to trade near $40.00 per share. VZ is followed by American Express Co. (AXP), gaining 2.5% to trade near $238.75 per share.
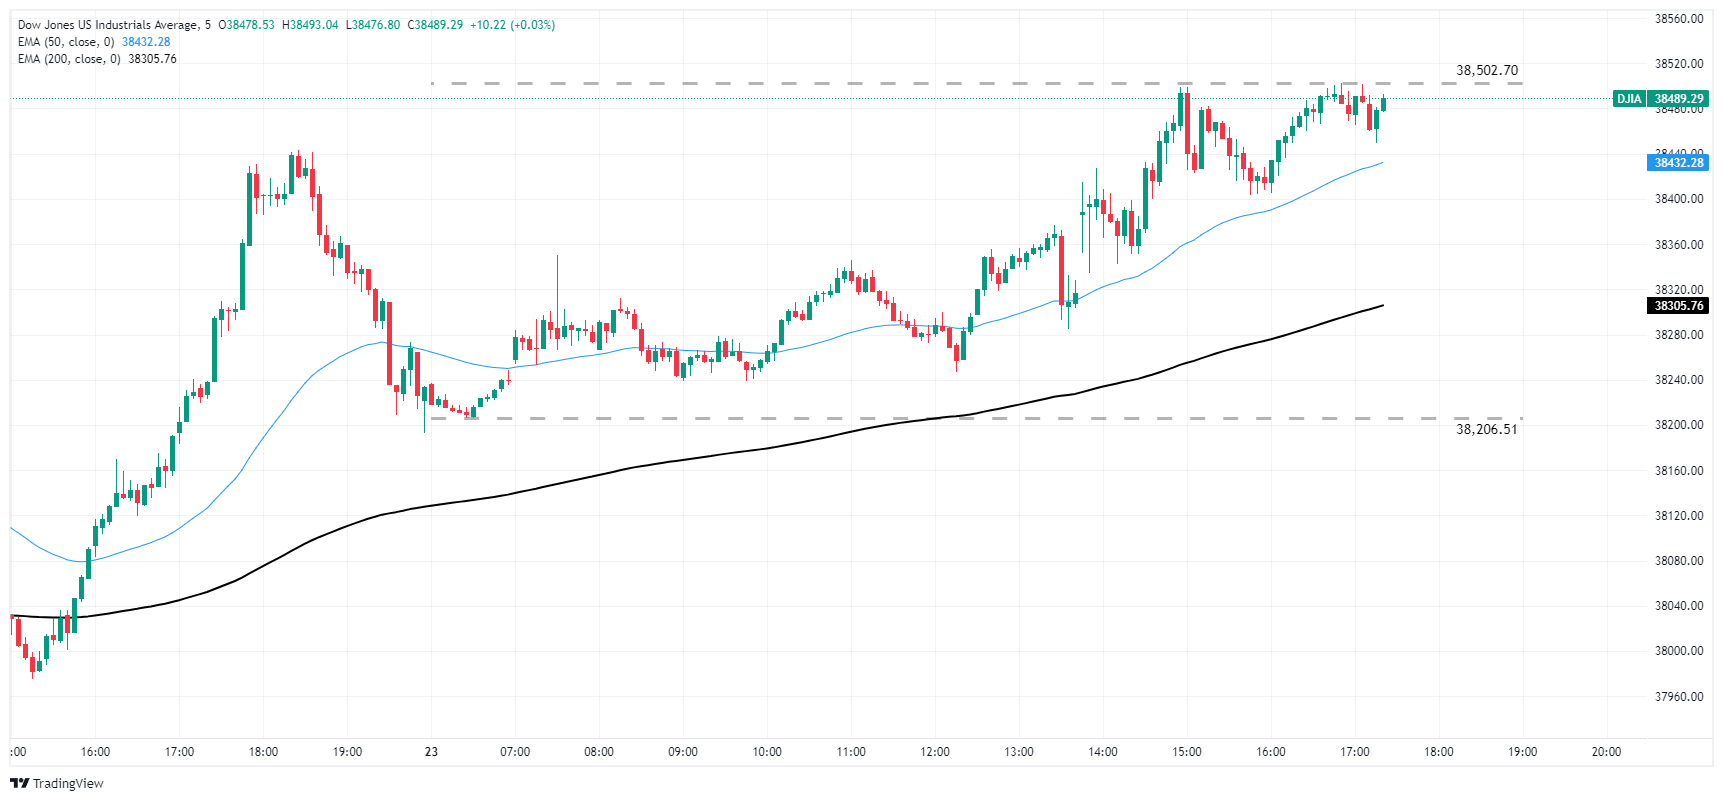
The Dow Jones is testing the 38,500.00 handle on Tuesday, with the day's early low priced in at 38,206.51. The major equity index is up nearly eight-tenths of a percent on the day.
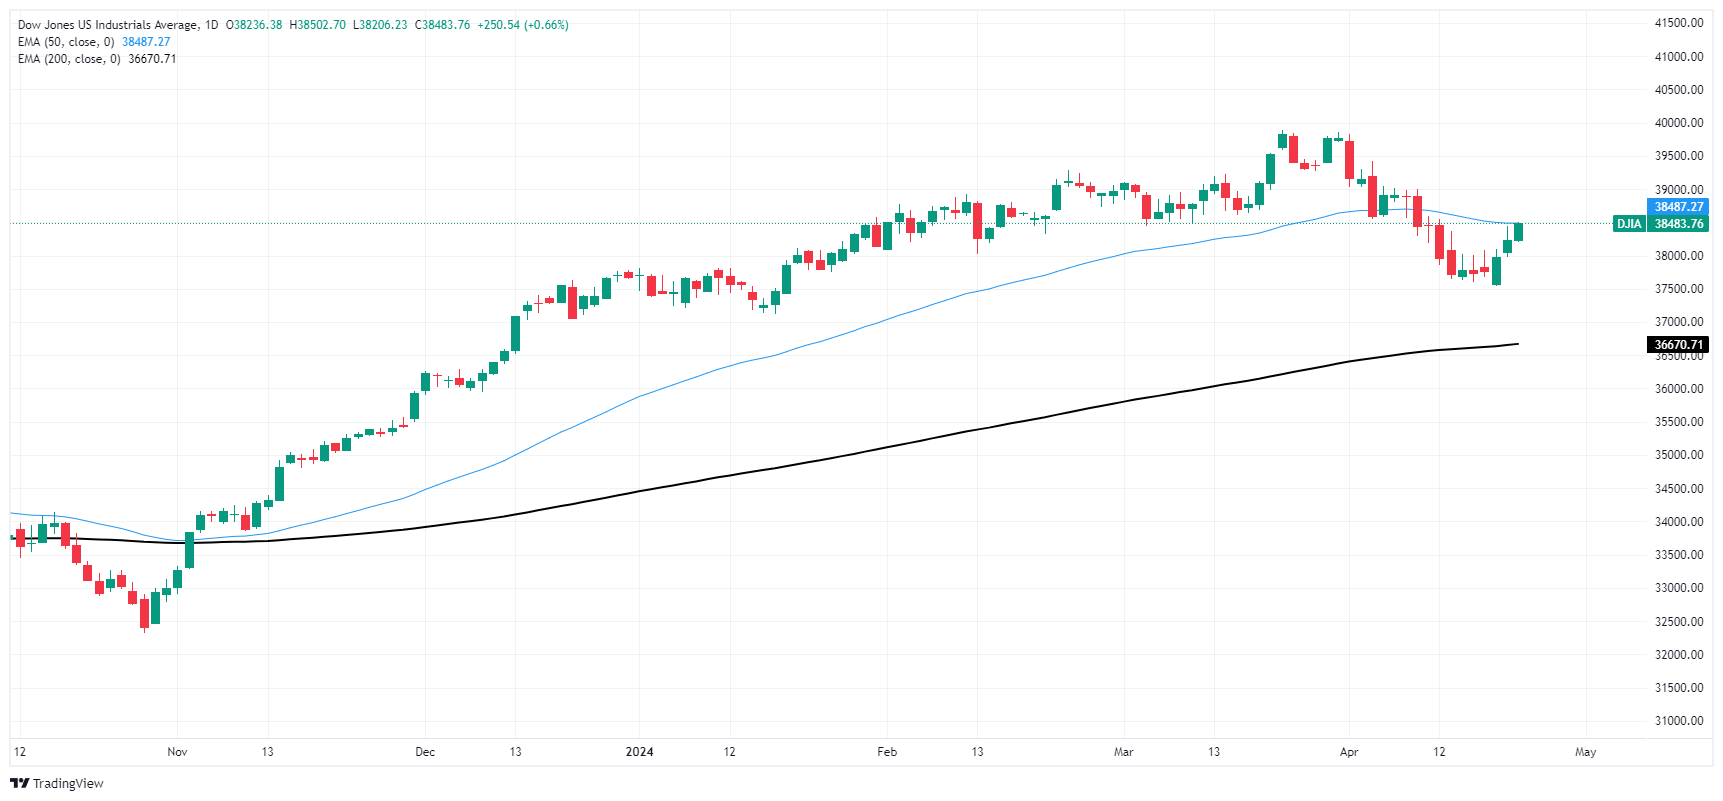
Tuesday's upside leaves the Dow Jones on pace to close in the green for a third straight trading day as the index climbs from a near-term swing low around 37,600.00. The index is still down from March's highs just shy of the 40,000.00 major handle, but the index is firmly bullish in the long-term. The Dow Jones is trading well above major technical support from the 200-day Exponential Moving Average (EMA) at 36,687.91.
The Dow Jones Industrial Average, one of the oldest stock market indices in the world, is compiled of the 30 most traded stocks in the US. The index is price-weighted rather than weighted by capitalization. It is calculated by summing the prices of the constituent stocks and dividing them by a factor, currently 0.152. The index was founded by Charles Dow, who also founded the Wall Street Journal. In later years it has been criticized for not being broadly representative enough because it only tracks 30 conglomerates, unlike broader indices such as the S&P 500.
Many different factors drive the Dow Jones Industrial Average (DJIA). The aggregate performance of the component companies revealed in quarterly company earnings reports is the main one. US and global macroeconomic data also contributes as it impacts on investor sentiment. The level of interest rates, set by the Federal Reserve (Fed), also influences the DJIA as it affects the cost of credit, on which many corporations are heavily reliant. Therefore, inflation can be a major driver as well as other metrics which impact the Fed decisions.
Dow Theory is a method for identifying the primary trend of the stock market developed by Charles Dow. A key step is to compare the direction of the Dow Jones Industrial Average (DJIA) and the Dow Jones Transportation Average (DJTA) and only follow trends where both are moving in the same direction. Volume is a confirmatory criteria. The theory uses elements of peak and trough analysis. Dow's theory posits three trend phases: accumulation, when smart money starts buying or selling; public participation, when the wider public joins in; and distribution, when the smart money exits.
There are a number of ways to trade the DJIA. One is to use ETFs which allow investors to trade the DJIA as a single security, rather than having to buy shares in all 30 constituent companies. A leading example is the SPDR Dow Jones Industrial Average ETF (DIA). DJIA futures contracts enable traders to speculate on the future value of the index and Options provide the right, but not the obligation, to buy or sell the index at a predetermined price in the future. Mutual funds enable investors to buy a share of a diversified portfolio of DJIA stocks thus providing exposure to the overall index.
![]()
Created
: 2024.04.24
![]()
Last updated
: 2024.04.24

FXStreet is a forex information website, delivering market analysis and news articles 24/7.
It features a number of articles contributed by well-known analysts, in addition to the ones by its editorial team.
Founded in 2000 by Francesc Riverola, a Spanish economist, it has grown to become a world-renowned information website.
We hope you find this article useful. Any comments or suggestions will be greatly appreciated.
We are also looking for writers with extensive experience in forex and crypto to join us.
please contact us at [email protected].
Disclaimer:![]()
All information and content provided on this website is provided for informational purposes only and is not intended to solicit any investment. Although all efforts are made in order to ensure that the information is correct, no guarantee is provided for the accuracy of any content on this website. Any decision made shall be the responsibility of the investor and Myforex does not take any responsibility whatsoever regarding the use of any information provided herein.
The content provided on this website belongs to Myforex and, where stated, the relevant licensors. All rights are reserved by Myforex and the relevant licensors, and no content of this website, whether in full or in part, shall be copied or displayed elsewhere without the explicit written permission of the relevant copyright holder. If you wish to use any part of the content provided on this website, please ensure that you contact Myforex.
Myforex uses cookies to improve the convenience and functionality of this website. This website may include cookies not only by us but also by third parties (advertisers, log analysts, etc.) for the purpose of tracking the activities of users. Cookie policy
