Created
: 2025.07.15


![]() 2025.07.15 14:33
2025.07.15 14:33
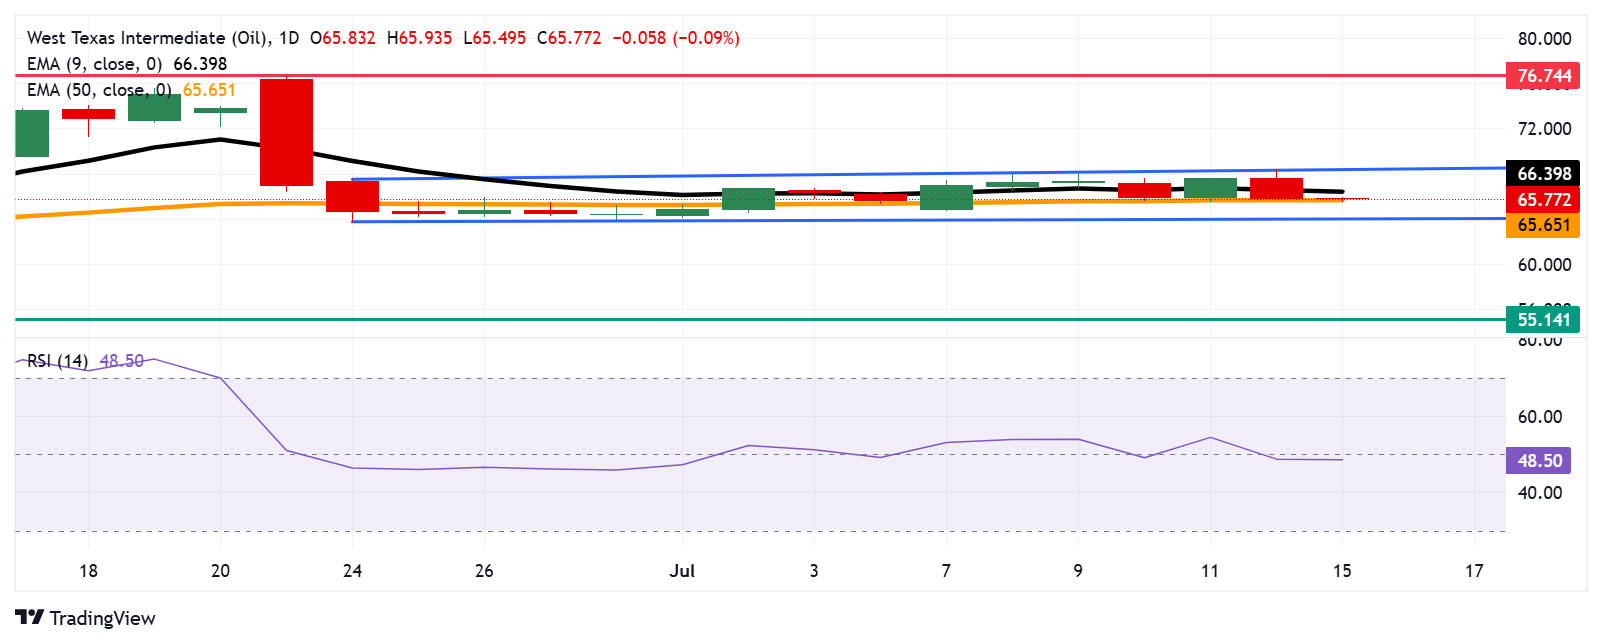
West Texas Intermediate (WTI) Oil price extends its losses for the second successive session, trading around $65.80 per barrel during the European hours on Tuesday. The technical analysis of the daily chart suggests the price of the precious metal remains within a rectangular pattern, indicating a consolidation phase.
The 14-day Relative Strength Index (RSI) remains below the 50 level, suggesting a bearish bias is in play. Additionally, the Silver price is trading below the nine-day Exponential Moving Average (EMA), indicating potential weakening of short-term price momentum.
On the downside, the WTI price is testing the immediate support at the 50-day EMA of $65.65. A break below this level would weaken the medium-term price momentum and prompt the WTI price to approach the lower boundary of the rectangle around the psychological level of $64.00. A break below the rectangle would cause the emergence of the bearish bias and put downward pressure on the Oil price to navigate the region around the three-month low at $55.14, recorded on May 5.
The WTI price may find initial resistance around the nine-day EMA at $66.39. A break above the latter would improve the short-term price momentum and support the Oil price to approach the upper boundary of the rectangle around $68.50. A break above the rectangle would give rise to bullish bias and support the crude price to test the six-month high of $76.74, which was reached on June 23.
WTI Oil is a type of Crude Oil sold on international markets. The WTI stands for West Texas Intermediate, one of three major types including Brent and Dubai Crude. WTI is also referred to as "light" and "sweet" because of its relatively low gravity and sulfur content respectively. It is considered a high quality Oil that is easily refined. It is sourced in the United States and distributed via the Cushing hub, which is considered "The Pipeline Crossroads of the World". It is a benchmark for the Oil market and WTI price is frequently quoted in the media.
Like all assets, supply and demand are the key drivers of WTI Oil price. As such, global growth can be a driver of increased demand and vice versa for weak global growth. Political instability, wars, and sanctions can disrupt supply and impact prices. The decisions of OPEC, a group of major Oil-producing countries, is another key driver of price. The value of the US Dollar influences the price of WTI Crude Oil, since Oil is predominantly traded in US Dollars, thus a weaker US Dollar can make Oil more affordable and vice versa.
The weekly Oil inventory reports published by the American Petroleum Institute (API) and the Energy Information Agency (EIA) impact the price of WTI Oil. Changes in inventories reflect fluctuating supply and demand. If the data shows a drop in inventories it can indicate increased demand, pushing up Oil price. Higher inventories can reflect increased supply, pushing down prices. API's report is published every Tuesday and EIA's the day after. Their results are usually similar, falling within 1% of each other 75% of the time. The EIA data is considered more reliable, since it is a government agency.
OPEC (Organization of the Petroleum Exporting Countries) is a group of 12 Oil-producing nations who collectively decide production quotas for member countries at twice-yearly meetings. Their decisions often impact WTI Oil prices. When OPEC decides to lower quotas, it can tighten supply, pushing up Oil prices. When OPEC increases production, it has the opposite effect. OPEC+ refers to an expanded group that includes ten extra non-OPEC members, the most notable of which is Russia.
![]()
Created
: 2025.07.15
![]()
Last updated
: 2025.07.15

FXStreet is a forex information website, delivering market analysis and news articles 24/7.
It features a number of articles contributed by well-known analysts, in addition to the ones by its editorial team.
Founded in 2000 by Francesc Riverola, a Spanish economist, it has grown to become a world-renowned information website.
We hope you find this article useful. Any comments or suggestions will be greatly appreciated.
We are also looking for writers with extensive experience in forex and crypto to join us.
please contact us at [email protected].
Disclaimer:![]()
All information and content provided on this website is provided for informational purposes only and is not intended to solicit any investment. Although all efforts are made in order to ensure that the information is correct, no guarantee is provided for the accuracy of any content on this website. Any decision made shall be the responsibility of the investor and Myforex does not take any responsibility whatsoever regarding the use of any information provided herein.
The content provided on this website belongs to Myforex and, where stated, the relevant licensors. All rights are reserved by Myforex and the relevant licensors, and no content of this website, whether in full or in part, shall be copied or displayed elsewhere without the explicit written permission of the relevant copyright holder. If you wish to use any part of the content provided on this website, please ensure that you contact Myforex.
Myforex uses cookies to improve the convenience and functionality of this website. This website may include cookies not only by us but also by third parties (advertisers, log analysts, etc.) for the purpose of tracking the activities of users. Cookie policy
