Created
: 2025.10.08


![]() 2025.10.08 14:34
2025.10.08 14:34
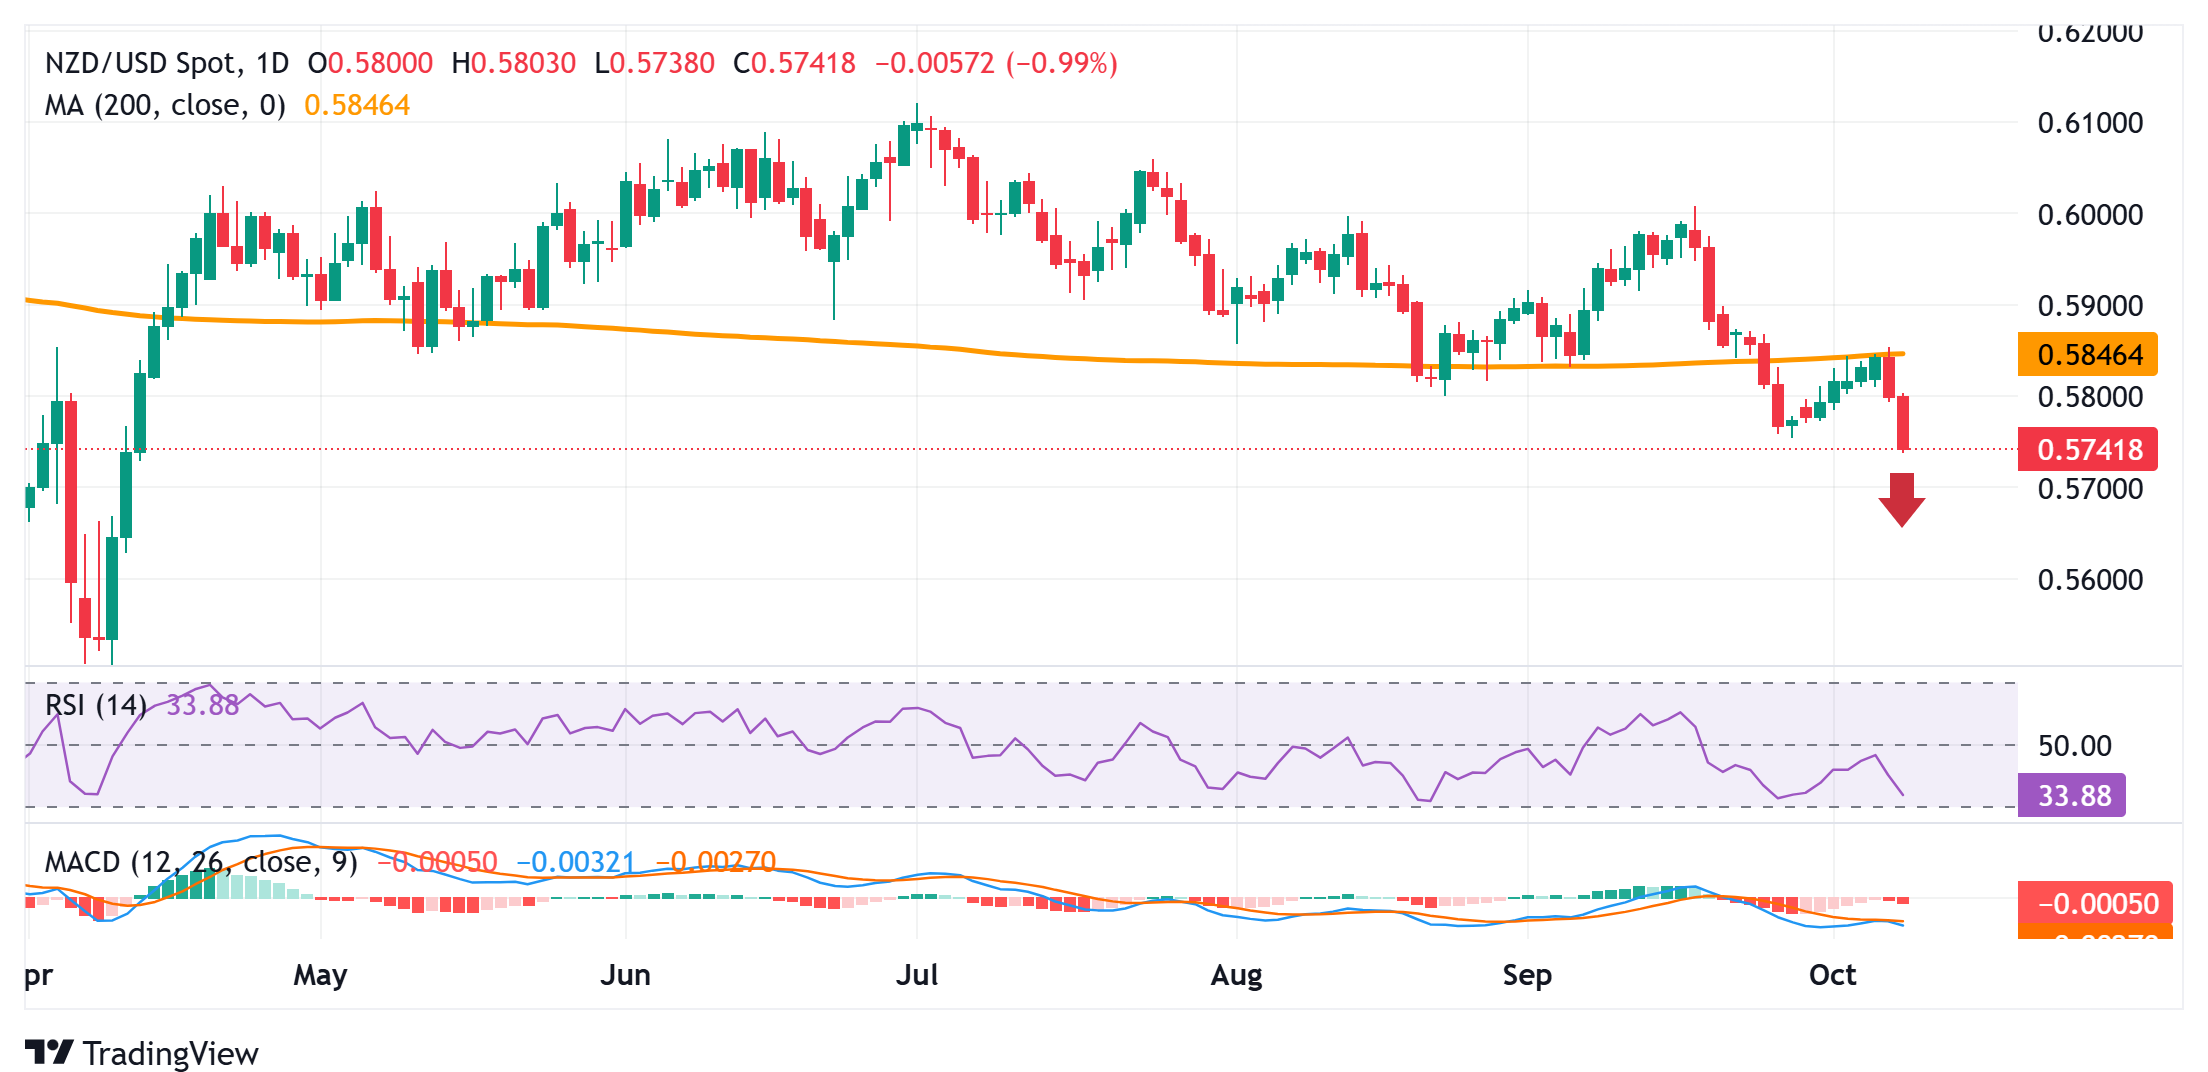
The NZD/USD pair extends the previous day's sharp retracement slide from levels just above mid-0.5800s, or a nearly two-week high, and attracts heavy selling for the second straight day on Wednesday. The steep intraday decline drags spot prices to the 0.5740-0.5735 region, or the lowest level since April 11 during the Asian session, and is sponsored by a combination of factors.
The New Zealand Dollar (NZD) weakens across the board in reaction to the Reserve Bank of New Zealand's (RBNZ) surprise 50 basis points (bps) rate cut and a dovish outlook. In fact, the central bank showed readiness to cut rates further as required for inflation to settle sustainably near the 2% target mid-point in the medium term. This, along with sustained US Dollar (USD) buying, turns out to be another factor exerting downward pressure on the NZD/USD pair.
From a technical perspective, the overnight failure near the very important 200-day Simple Moving Average (SMA) and the subsequent decline favors bearish traders. Moreover, oscillators on the daily chart remain in negative territory and are still away from being in the oversold zone, suggesting that the path of least resistance for the NZD/USD pair is to the downside. Hence, some follow-through weakness, towards the 0.5700 round figure, looks like a distinct possibility.
A convincing break below the said handle could make the NZD/USD pair vulnerable to extend the downfall towards the 0.5665 region en route to the 0.5610-0.5600 area and the next relevant support near the 0.5580-0.5575 zone.
On the flip side, any attempted recovery beyond the 0.5770 region is likely to confront stiff resistance near the 0.5800 mark. A sustained strength beyond the latter, however, might trigger a short-covering rally and lift the NZD/USD pair back towards the 200-day SMA barrier, currently around mid-0.5800s. Some follow-through buying would negate the near-term negative outlook and shift the bias in favor of bullish traders, paving the way towards reclaiming the 0.5900 mark.
The table below shows the percentage change of US Dollar (USD) against listed major currencies this week. US Dollar was the strongest against the Japanese Yen.
| USD | EUR | GBP | JPY | CAD | AUD | NZD | CHF | |
|---|---|---|---|---|---|---|---|---|
| USD | 0.92% | 0.44% | 1.93% | 0.08% | 0.36% | 1.32% | 0.61% | |
| EUR | -0.92% | -0.58% | 0.92% | -0.87% | -0.59% | 0.36% | -0.34% | |
| GBP | -0.44% | 0.58% | 1.61% | -0.29% | -0.01% | 0.95% | 0.25% | |
| JPY | -1.93% | -0.92% | -1.61% | -1.77% | -1.59% | -0.67% | -1.33% | |
| CAD | -0.08% | 0.87% | 0.29% | 1.77% | 0.32% | 1.25% | 0.54% | |
| AUD | -0.36% | 0.59% | 0.01% | 1.59% | -0.32% | 0.96% | 0.25% | |
| NZD | -1.32% | -0.36% | -0.95% | 0.67% | -1.25% | -0.96% | -0.70% | |
| CHF | -0.61% | 0.34% | -0.25% | 1.33% | -0.54% | -0.25% | 0.70% |
The heat map shows percentage changes of major currencies against each other. The base currency is picked from the left column, while the quote currency is picked from the top row. For example, if you pick the US Dollar from the left column and move along the horizontal line to the Japanese Yen, the percentage change displayed in the box will represent USD (base)/JPY (quote).
![]()
Created
: 2025.10.08
![]()
Last updated
: 2025.10.08

FXStreet is a forex information website, delivering market analysis and news articles 24/7.
It features a number of articles contributed by well-known analysts, in addition to the ones by its editorial team.
Founded in 2000 by Francesc Riverola, a Spanish economist, it has grown to become a world-renowned information website.
We hope you find this article useful. Any comments or suggestions will be greatly appreciated.
We are also looking for writers with extensive experience in forex and crypto to join us.
please contact us at [email protected].
Disclaimer:![]()
All information and content provided on this website is provided for informational purposes only and is not intended to solicit any investment. Although all efforts are made in order to ensure that the information is correct, no guarantee is provided for the accuracy of any content on this website. Any decision made shall be the responsibility of the investor and Myforex does not take any responsibility whatsoever regarding the use of any information provided herein.
The content provided on this website belongs to Myforex and, where stated, the relevant licensors. All rights are reserved by Myforex and the relevant licensors, and no content of this website, whether in full or in part, shall be copied or displayed elsewhere without the explicit written permission of the relevant copyright holder. If you wish to use any part of the content provided on this website, please ensure that you contact Myforex.
Myforex uses cookies to improve the convenience and functionality of this website. This website may include cookies not only by us but also by third parties (advertisers, log analysts, etc.) for the purpose of tracking the activities of users. Cookie policy
