Created
: 2025.10.02


![]() 2025.10.02 00:50
2025.10.02 00:50
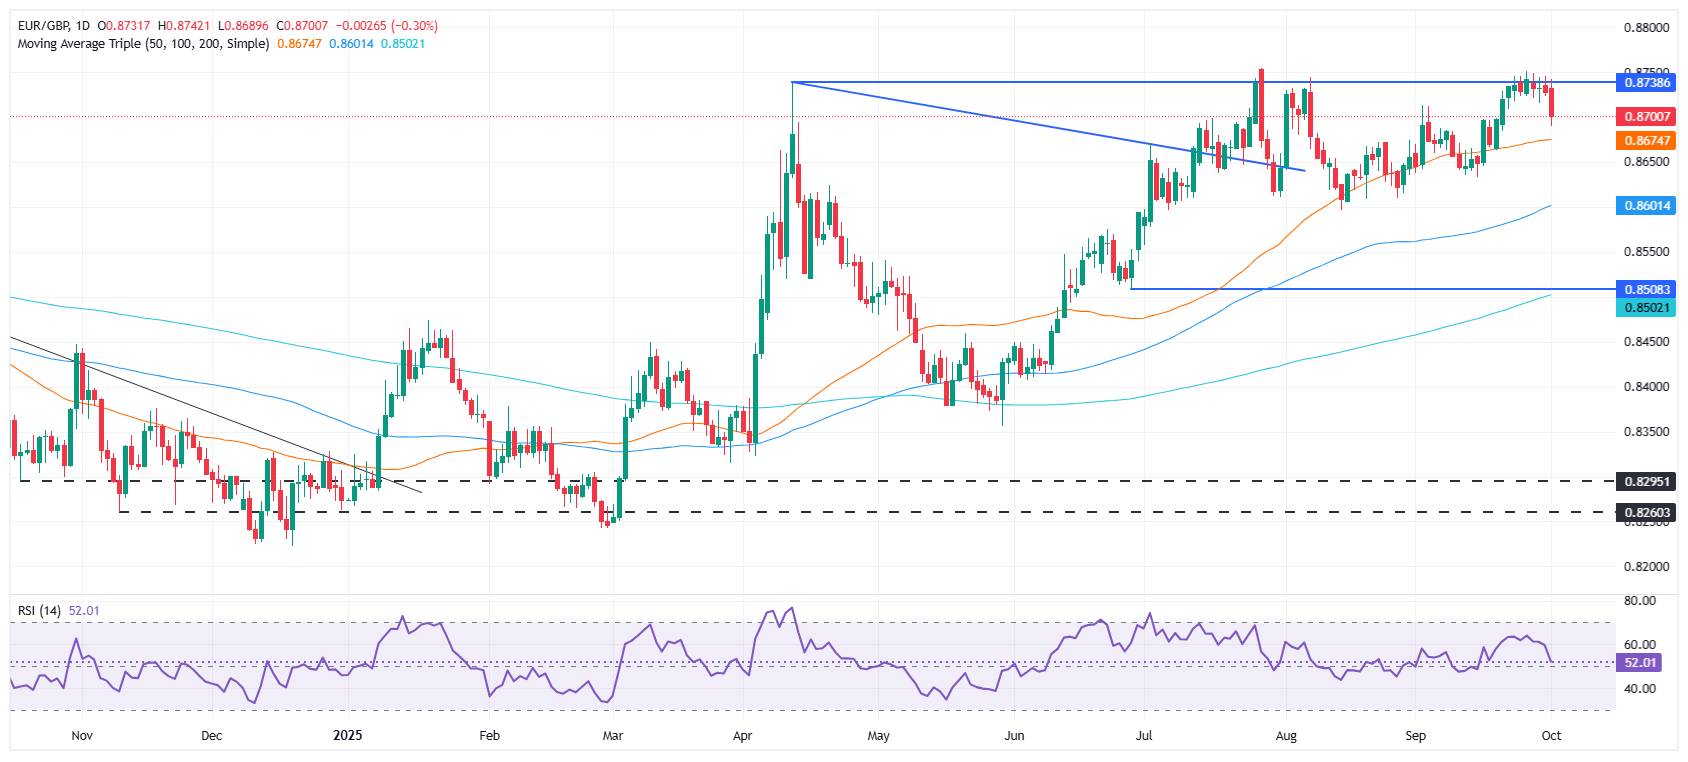
The EUR/GBP drops during the North American session after the latest release of inflation in the Eurozone came aligned with estimates, but slightly above the European Central Bank (ECB) goal. The cross trades around 0.8696, down 0.36%.
Europe revealed that inflation rose by 2.2% YoY in September, aligned with estimates but above August's 2% print. Excluding volatile items, the so-called core Harmonized Index of Consumer Prices (HICP) for the bloc was steady at 2.3% YoY, as foreseen.
Other data revealed that business activity in the EZ improved, with the HCOB Manufacturing PMI rising from 48.5 to 49.5 in September, above estimates of 48.5.
In the UK, the S&P Global Manufacturing PMI contracted in September, yet it seems to stabilize after remaining unchanged at 46.2 as in August.
On Tuesday, traders digested the release of Gross Domestic Product (GDP) figures for Britian, which shown the economy stagnated in Q2. In the meantime, British households are facing high inflation, also a possible tax increase by the finance minister Rachel Reeve, would put pressure on the British Pound.
The EUR/GBP seems to have peaked as depicted by the technical picture, although retreated, bounced off a key support level at the 20-day Simple Moving Average (SMA) at 0.8694, which drove the pair above 0.8700.
Momentum indicates that sellers are in charge, but the Relative Strength Index (RSI) remains above its neutral level, suggesting that buyers are stepping in.
If the cross ends on a daily basis above 0.8700, buyers could test the daily high of 0.8742. key resistance levels lie overhead, like the yearly peak at 0.8757 and 0.8800. On the other hand, the first support is the 20-day SMA at 0.8694, followed by the 50-day SMA at 0.5674.
The table below shows the percentage change of Euro (EUR) against listed major currencies last 30 days. Euro was the strongest against the Canadian Dollar.
| USD | EUR | GBP | JPY | CAD | AUD | NZD | CHF | |
|---|---|---|---|---|---|---|---|---|
| USD | -0.28% | 0.11% | 0.07% | 1.55% | -0.88% | 1.34% | -0.21% | |
| EUR | 0.28% | 0.39% | 0.29% | 1.83% | -0.61% | 1.62% | 0.08% | |
| GBP | -0.11% | -0.39% | -0.22% | 1.44% | -0.99% | 1.23% | -0.26% | |
| JPY | -0.07% | -0.29% | 0.22% | 1.55% | -0.95% | 1.30% | -0.25% | |
| CAD | -1.55% | -1.83% | -1.44% | -1.55% | -2.39% | -0.20% | -1.67% | |
| AUD | 0.88% | 0.61% | 0.99% | 0.95% | 2.39% | 2.25% | 0.73% | |
| NZD | -1.34% | -1.62% | -1.23% | -1.30% | 0.20% | -2.25% | -1.48% | |
| CHF | 0.21% | -0.08% | 0.26% | 0.25% | 1.67% | -0.73% | 1.48% |
The heat map shows percentage changes of major currencies against each other. The base currency is picked from the left column, while the quote currency is picked from the top row. For example, if you pick the Euro from the left column and move along the horizontal line to the US Dollar, the percentage change displayed in the box will represent EUR (base)/USD (quote).
![]()
Created
: 2025.10.02
![]()
Last updated
: 2025.10.02

FXStreet is a forex information website, delivering market analysis and news articles 24/7.
It features a number of articles contributed by well-known analysts, in addition to the ones by its editorial team.
Founded in 2000 by Francesc Riverola, a Spanish economist, it has grown to become a world-renowned information website.
We hope you find this article useful. Any comments or suggestions will be greatly appreciated.
We are also looking for writers with extensive experience in forex and crypto to join us.
please contact us at [email protected].
Disclaimer:![]()
All information and content provided on this website is provided for informational purposes only and is not intended to solicit any investment. Although all efforts are made in order to ensure that the information is correct, no guarantee is provided for the accuracy of any content on this website. Any decision made shall be the responsibility of the investor and Myforex does not take any responsibility whatsoever regarding the use of any information provided herein.
The content provided on this website belongs to Myforex and, where stated, the relevant licensors. All rights are reserved by Myforex and the relevant licensors, and no content of this website, whether in full or in part, shall be copied or displayed elsewhere without the explicit written permission of the relevant copyright holder. If you wish to use any part of the content provided on this website, please ensure that you contact Myforex.
Myforex uses cookies to improve the convenience and functionality of this website. This website may include cookies not only by us but also by third parties (advertisers, log analysts, etc.) for the purpose of tracking the activities of users. Cookie policy
