Created
: 2025.09.17


![]() 2025.09.17 13:01
2025.09.17 13:01
Gold (XAU/USD) attracts some sellers during the Asian session on Wednesday and moves away from the all-time peak, levels just above the $3,700 mark touched the previous day. The commodity trades with modest losses around the $3,680 and, for now, seems to have snapped a three-day winning streak, though any meaningful corrective decline seems elusive. The US Dollar (USD) stages a modest bounce from its lowest level since early July amid some repositioning trade ahead of the crucial FOMC rate decision, and turns out to be a key factor exerting some pressure on the precious metal.
However, rising bets for a more aggressive policy easing by the US central bank might keep a lid on the attempted USD recovery and continue to offer some support to the non-yielding Gold. Furthermore, rising geopolitical tensions and the cautious market mood might contribute to limiting losses for the safe-haven XAU/USD pair. Traders might also opt to wait for more cues about the Fed's rate-cut path before placing fresh directional bets around the non-yielding yellow metal. This, in turn, makes it prudent to wait for strong follow-through selling before confirming that the commodity has topped out.
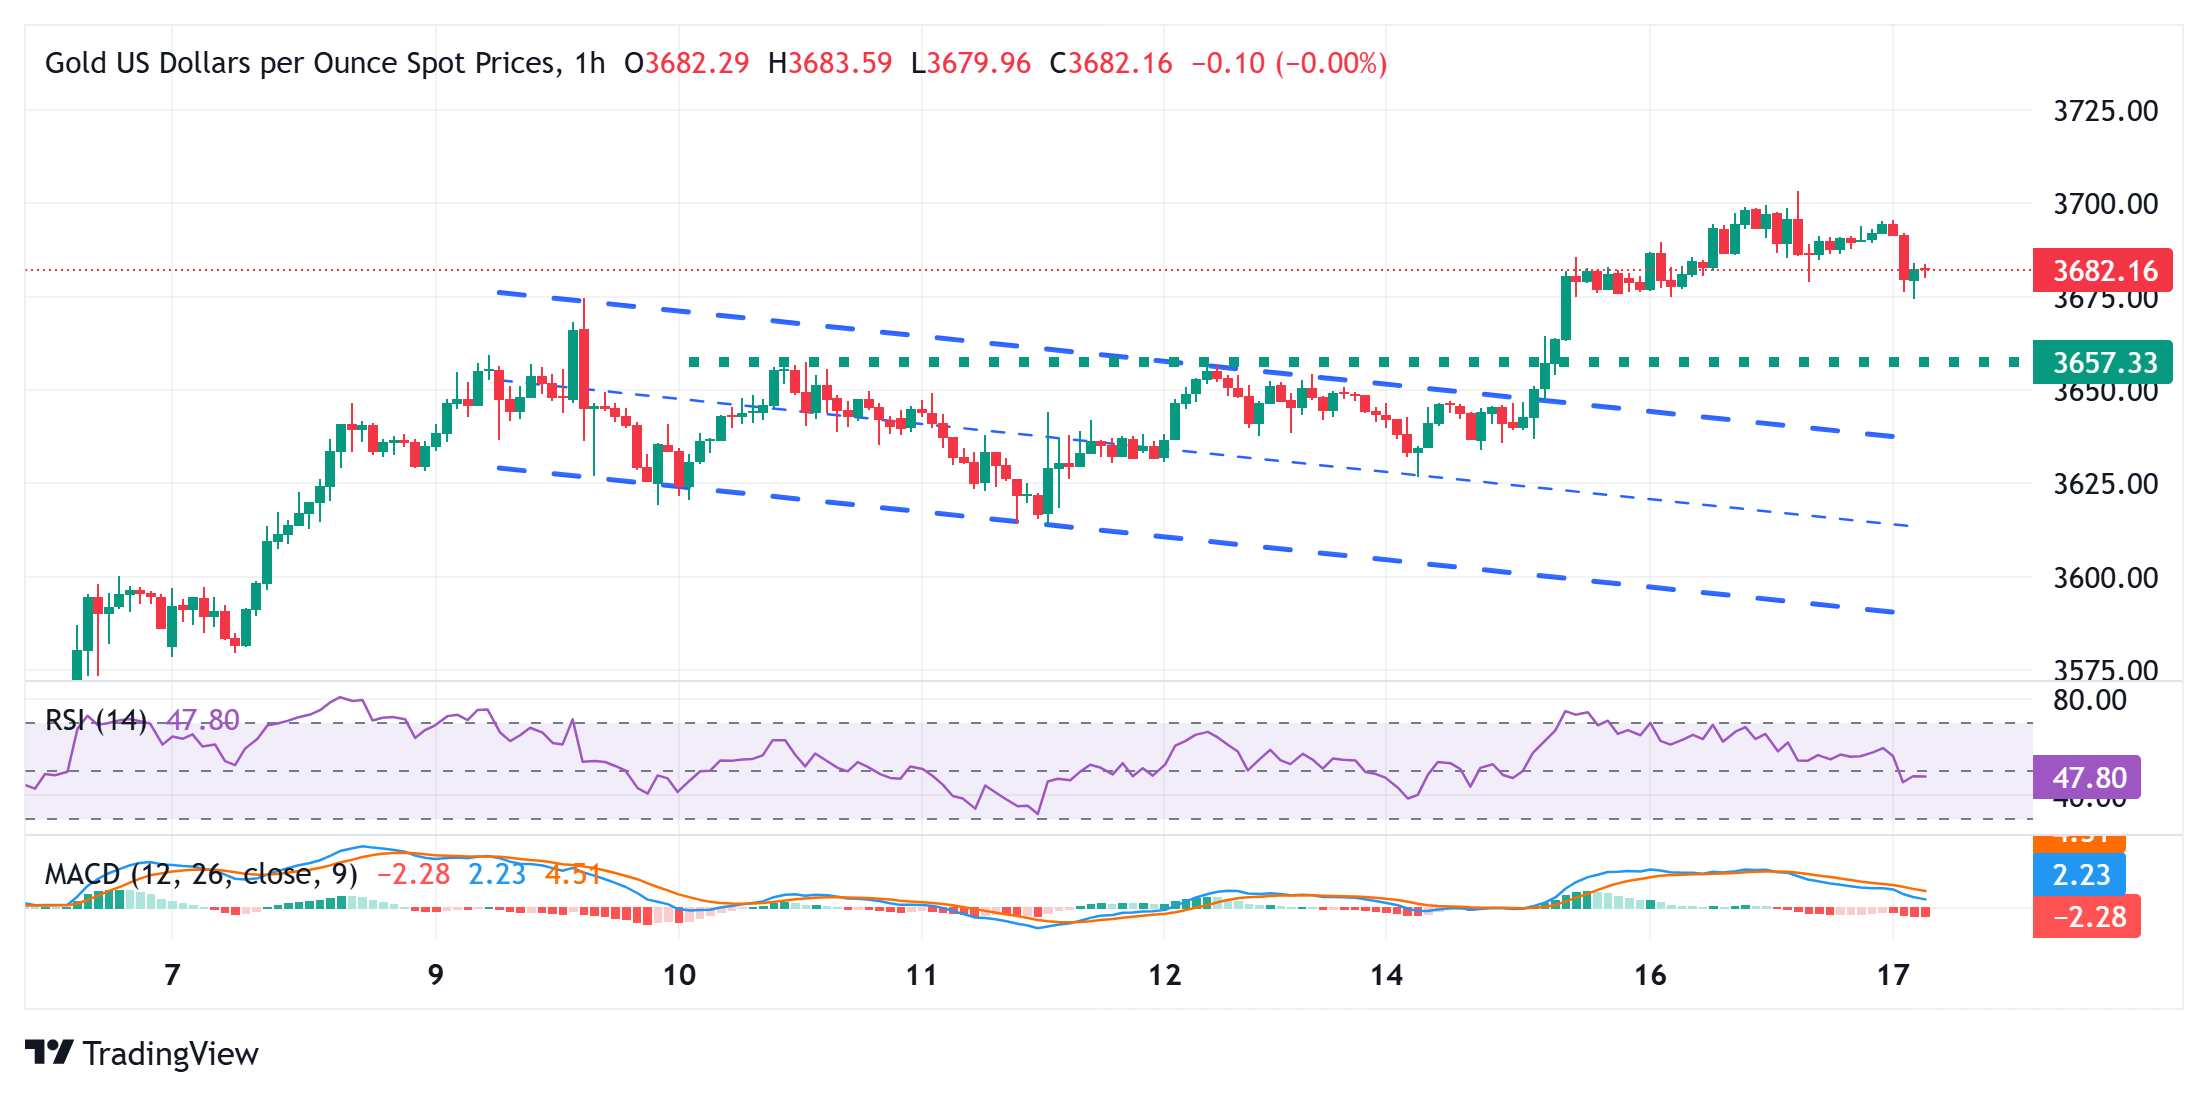
From a technical perspective, the overbought daily Relative Strength Index (RSI) turns out to be a key factor prompting some profit-taking around the commodity. However, this week's breakout through a bullish flag pattern suggests that any further decline could be seen as a buying opportunity near the $3,645 resistance breakpoint. However, some follow-through selling, leading to a subsequent fall below the $3,633 horizontal zone, could drag the Gold price to the $3,610-3,600 area.
The latter should act as a strong base for the XAU/USD pair, which, if broken, could pave the way for deeper losses towards an intermediate support near the $3,562-3,560 region en route to the $3,500 psychological mark. On the flip side, bulls might now wait for sustained strength and acceptance above the $3,700 mark before positioning for an extension of the recent well-established uptrend witnessed over the past month or so.
The table below shows the percentage change of US Dollar (USD) against listed major currencies today. US Dollar was the strongest against the Swiss Franc.
| USD | EUR | GBP | JPY | CAD | AUD | NZD | CHF | |
|---|---|---|---|---|---|---|---|---|
| USD | 0.10% | 0.04% | 0.03% | 0.09% | -0.00% | 0.00% | 0.16% | |
| EUR | -0.10% | -0.08% | -0.09% | 0.01% | 0.02% | 0.03% | 0.06% | |
| GBP | -0.04% | 0.08% | 0.00% | 0.09% | -0.05% | -0.02% | 0.06% | |
| JPY | -0.03% | 0.09% | 0.00% | 0.06% | 0.08% | -0.00% | 0.00% | |
| CAD | -0.09% | -0.01% | -0.09% | -0.06% | -0.02% | -0.03% | 0.05% | |
| AUD | 0.00% | -0.02% | 0.05% | -0.08% | 0.02% | 0.03% | 0.04% | |
| NZD | -0.01% | -0.03% | 0.02% | 0.00% | 0.03% | -0.03% | 0.05% | |
| CHF | -0.16% | -0.06% | -0.06% | -0.01% | -0.05% | -0.04% | -0.05% |
The heat map shows percentage changes of major currencies against each other. The base currency is picked from the left column, while the quote currency is picked from the top row. For example, if you pick the US Dollar from the left column and move along the horizontal line to the Japanese Yen, the percentage change displayed in the box will represent USD (base)/JPY (quote).
![]()
Created
: 2025.09.17
![]()
Last updated
: 2025.09.17

FXStreet is a forex information website, delivering market analysis and news articles 24/7.
It features a number of articles contributed by well-known analysts, in addition to the ones by its editorial team.
Founded in 2000 by Francesc Riverola, a Spanish economist, it has grown to become a world-renowned information website.
We hope you find this article useful. Any comments or suggestions will be greatly appreciated.
We are also looking for writers with extensive experience in forex and crypto to join us.
please contact us at [email protected].
Disclaimer:![]()
All information and content provided on this website is provided for informational purposes only and is not intended to solicit any investment. Although all efforts are made in order to ensure that the information is correct, no guarantee is provided for the accuracy of any content on this website. Any decision made shall be the responsibility of the investor and Myforex does not take any responsibility whatsoever regarding the use of any information provided herein.
The content provided on this website belongs to Myforex and, where stated, the relevant licensors. All rights are reserved by Myforex and the relevant licensors, and no content of this website, whether in full or in part, shall be copied or displayed elsewhere without the explicit written permission of the relevant copyright holder. If you wish to use any part of the content provided on this website, please ensure that you contact Myforex.
Myforex uses cookies to improve the convenience and functionality of this website. This website may include cookies not only by us but also by third parties (advertisers, log analysts, etc.) for the purpose of tracking the activities of users. Cookie policy
