Created
: 2025.09.03


![]() 2025.09.03 01:21
2025.09.03 01:21
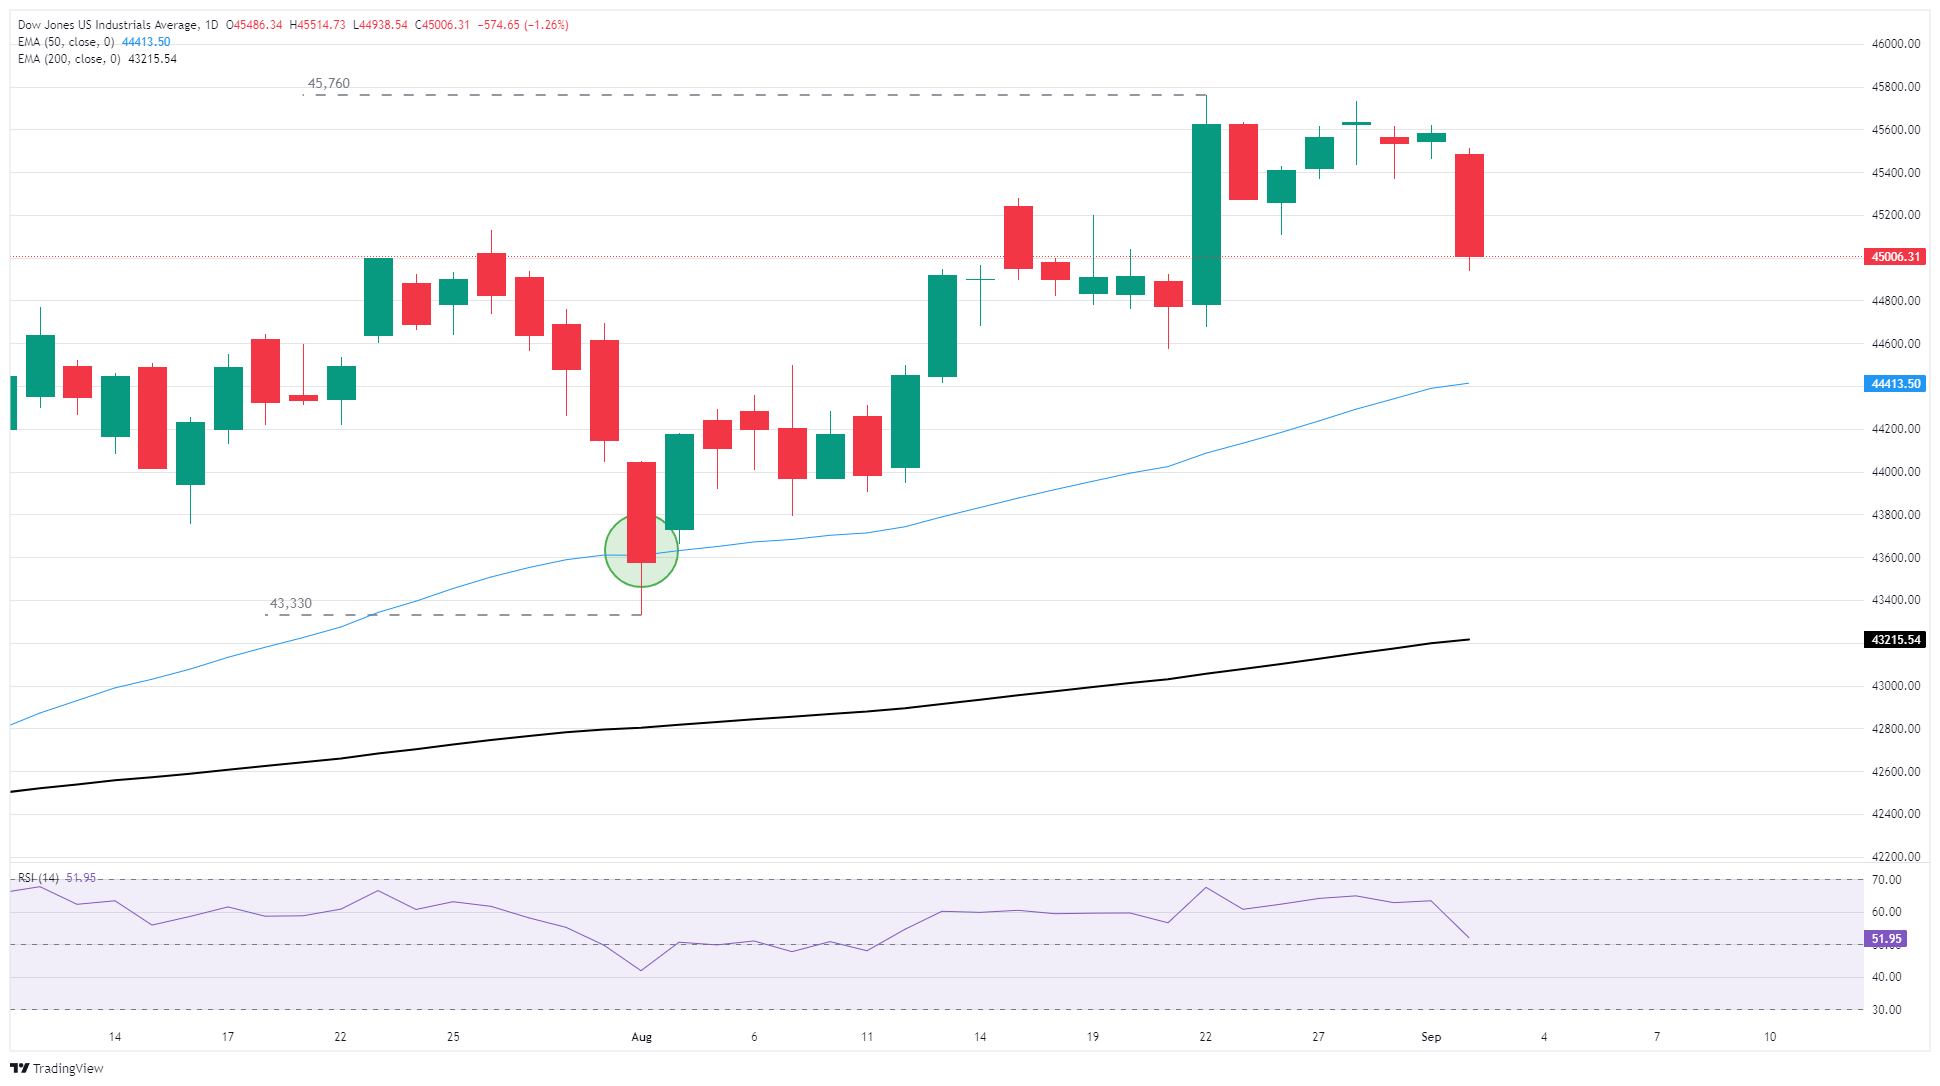
The Dow Jones Industrial Average (DJIA) shed around 550 points on Tuesday, with American markets returning from a long weekend with renewed selling pressure. Rising bond yields, government funding concerns, and fresh inflation concerns pummel investor sentiment through the overnight session. US markets flubbed an attempt to right the equities ship after Institute for Supply Management (ISM) Manufacturing Purchasing Managers Index (PMI) figures showed a sixth straight month of contraction fears as firms continue to grapple with trade uncertainty.
Equity markets took a hit through the overnight session after global bond markets saw rising yields, driven in no small part by fresh concerns about government financing and debt levels across most of the developed world. Bearish momentum extended into the American market session, dragging US equity indexes lower across the board. September is historically a bad month for equities, and the trend appears to be intact at the outset.
The ISM's latest Manufacturing PMI rose to 48.7 in August, rebounding from the previous month's 48 but still falling just shy of the expected 49. The PMI posted its sixth straight month below the investor-eyed 50.0 level. Digging into the details of the report, gains are mostly being driven by price increases as inventories empty faster than they can be refilled. Manufacturing companies are broadly avoiding extra hiring in the face of tumultuous trade policies from the Trump administration, crimping supply chain stability. Inventories that surged to multi-year highs in the first half of the year are beginning to run dry, and companies are competing for limited goods as manufacturers continue to throttle back output capacity.
Respondents to ISM's PMI survey specifically noted that tariff impacts are still looming over the horizon. Unexpected import tariff increases targeting Brazil and India, as well as the elimination of sugar quotas and the rapidly rising cost of construction goods, were specifically highlighted as causes for a growing dry-up in new order growth. Trucking backlogs are declining rapidly, with respondents noting that activity levels are now worse than they were during the 2008 global financial crisis.
JOLTS Job Openings from July are due on Wednesday, and will be followed by the ISM's Services PMI component on Thursday, with US Nonfarm Payrolls (NFP) due on Friday. JOLTS have had a rough run as of late, with a poor correlation to US NFP figures over the past two years, but the private payroll estimator is set to take on renewed importance to investors who are rapidly losing faith in official figures. The Trump administration has been fast-tracking its strategy of sacking officials who allow unfavorable economic data to be published, putting pressure on investors to consider where they will get accurate data in the future.
The Dow Jones Industrial Average, one of the oldest stock market indices in the world, is compiled of the 30 most traded stocks in the US. The index is price-weighted rather than weighted by capitalization. It is calculated by summing the prices of the constituent stocks and dividing them by a factor, currently 0.152. The index was founded by Charles Dow, who also founded the Wall Street Journal. In later years it has been criticized for not being broadly representative enough because it only tracks 30 conglomerates, unlike broader indices such as the S&P 500.
Many different factors drive the Dow Jones Industrial Average (DJIA). The aggregate performance of the component companies revealed in quarterly company earnings reports is the main one. US and global macroeconomic data also contributes as it impacts on investor sentiment. The level of interest rates, set by the Federal Reserve (Fed), also influences the DJIA as it affects the cost of credit, on which many corporations are heavily reliant. Therefore, inflation can be a major driver as well as other metrics which impact the Fed decisions.
Dow Theory is a method for identifying the primary trend of the stock market developed by Charles Dow. A key step is to compare the direction of the Dow Jones Industrial Average (DJIA) and the Dow Jones Transportation Average (DJTA) and only follow trends where both are moving in the same direction. Volume is a confirmatory criteria. The theory uses elements of peak and trough analysis. Dow's theory posits three trend phases: accumulation, when smart money starts buying or selling; public participation, when the wider public joins in; and distribution, when the smart money exits.
There are a number of ways to trade the DJIA. One is to use ETFs which allow investors to trade the DJIA as a single security, rather than having to buy shares in all 30 constituent companies. A leading example is the SPDR Dow Jones Industrial Average ETF (DIA). DJIA futures contracts enable traders to speculate on the future value of the index and Options provide the right, but not the obligation, to buy or sell the index at a predetermined price in the future. Mutual funds enable investors to buy a share of a diversified portfolio of DJIA stocks thus providing exposure to the overall index.
![]()
Created
: 2025.09.03
![]()
Last updated
: 2025.09.03

FXStreet is a forex information website, delivering market analysis and news articles 24/7.
It features a number of articles contributed by well-known analysts, in addition to the ones by its editorial team.
Founded in 2000 by Francesc Riverola, a Spanish economist, it has grown to become a world-renowned information website.
We hope you find this article useful. Any comments or suggestions will be greatly appreciated.
We are also looking for writers with extensive experience in forex and crypto to join us.
please contact us at [email protected].
Disclaimer:![]()
All information and content provided on this website is provided for informational purposes only and is not intended to solicit any investment. Although all efforts are made in order to ensure that the information is correct, no guarantee is provided for the accuracy of any content on this website. Any decision made shall be the responsibility of the investor and Myforex does not take any responsibility whatsoever regarding the use of any information provided herein.
The content provided on this website belongs to Myforex and, where stated, the relevant licensors. All rights are reserved by Myforex and the relevant licensors, and no content of this website, whether in full or in part, shall be copied or displayed elsewhere without the explicit written permission of the relevant copyright holder. If you wish to use any part of the content provided on this website, please ensure that you contact Myforex.
Myforex uses cookies to improve the convenience and functionality of this website. This website may include cookies not only by us but also by third parties (advertisers, log analysts, etc.) for the purpose of tracking the activities of users. Cookie policy
