Created
: 2025.09.02


![]() 2025.09.02 21:26
2025.09.02 21:26
Gold (XAU/USD) retreats on Tuesday after briefly surging to a fresh all-time high of $3,508 per ounce during the Asian session as a rebound in the US Dollar (USD) and Treasury yields triggered mild profit-taking.
At the time of writing, the precious metal is trading near $3,485 at the start of the American session, extending a six-day winning streak. Despite the short correction, underlying demand remains strong on the back of safe-haven flows and expectations that the Federal Reserve (Fed) will lower the interest rates at its September 16-17 monetary policy meeting.
The metal's rally to record highs has been driven by persistent weakness in the Greenback, concerns over the Fed's independence following political criticism, and heightened geopolitical risks. Uncertainty over global trade policy, particularly around US tariffs, has also boosted demand for Gold as a hedge against economic and political instability. Investors continue to favor bullion in an environment where both growth risks and monetary easing prospects dominate the outlook.
Looking ahead, attention turns to the US ISM Manufacturing Purchasing Managers Index (PMI) for August, due later on Tuesday. The index is expected to edge up to 49.0 from 48.0 in July, though it would remain below the 50 threshold, signaling ongoing contraction in the factory sector. While the report is not the Fed's primary policy gauge, it often provides timely insights into demand conditions and price pressures. A weaker print would likely reinforce expectations for a September rate cut, supporting Gold, whereas a stronger reading could further buoy the US Dollar and Treasury yields, tempering Bullion's upside in the near term.
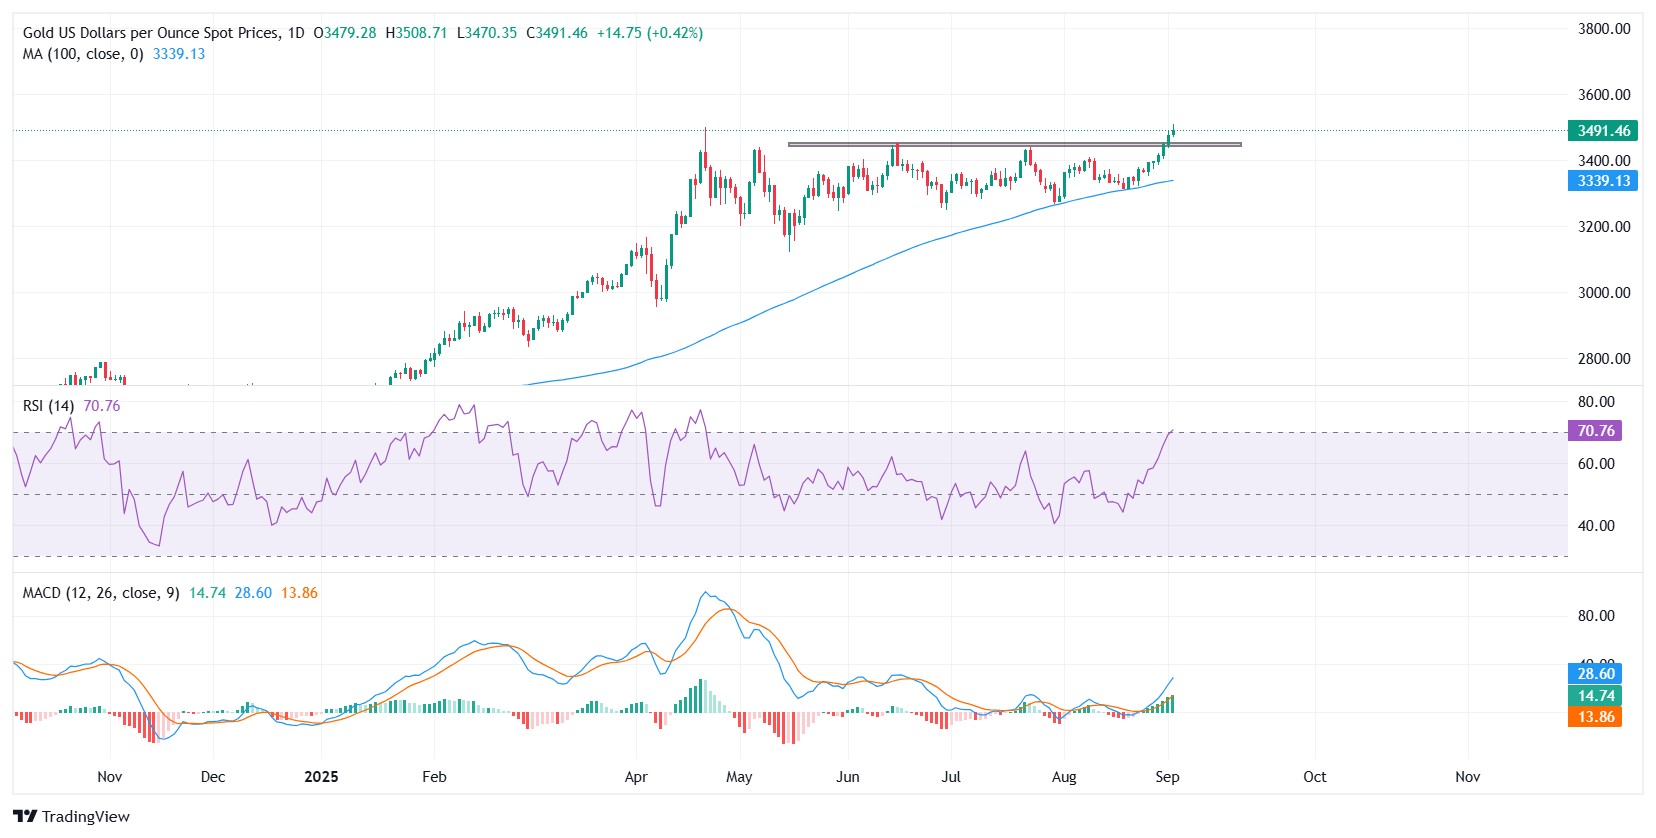
Gold extended its rally to a fresh all-time high at $3,508, breaking decisively above the $3,450 resistance zone that had capped price action in recent months. At the time of writing, the metal is consolidating near $3,485, holding gains above the breakout region with bulls maintaining control.
The Relative Strength Index (RSI) sits at 70, edging into overbought territory. This suggests upside momentum remains firm, though the risk of short-term consolidation or profit-taking has increased. Meanwhile, the Moving Average Convergence Divergence (MACD) maintains a firm positive crossover with the widening gap between the MACD and signal lines showing strengthening upside momentum. The increasing green histogram bars further confirm accelerating buying pressure, reinforcing the case for continued gains as long as Gold holds above near-term support.
On the upside, immediate support is seen at $3,470, followed by stronger backing at $3,450, the former breakout zone. A sustained move below this area could expose the $3,430-$3,400 region, where deeper pullbacks may attract fresh buying interest. On the upside, resistance is aligned at $3,500, with the all-time high at $3,508 serving as the next key hurdle.
The table below shows the percentage change of US Dollar (USD) against listed major currencies today. US Dollar was the strongest against the British Pound.
| USD | EUR | GBP | JPY | CAD | AUD | NZD | CHF | |
|---|---|---|---|---|---|---|---|---|
| USD | 0.68% | 1.40% | 1.12% | 0.34% | 0.84% | 0.96% | 0.55% | |
| EUR | -0.68% | 0.70% | 0.45% | -0.33% | 0.21% | 0.28% | -0.13% | |
| GBP | -1.40% | -0.70% | -0.26% | -1.02% | -0.51% | -0.41% | -0.82% | |
| JPY | -1.12% | -0.45% | 0.26% | -0.76% | -0.28% | -0.13% | -0.51% | |
| CAD | -0.34% | 0.33% | 1.02% | 0.76% | 0.47% | 0.65% | 0.21% | |
| AUD | -0.84% | -0.21% | 0.51% | 0.28% | -0.47% | 0.09% | -0.32% | |
| NZD | -0.96% | -0.28% | 0.41% | 0.13% | -0.65% | -0.09% | -0.41% | |
| CHF | -0.55% | 0.13% | 0.82% | 0.51% | -0.21% | 0.32% | 0.41% |
The heat map shows percentage changes of major currencies against each other. The base currency is picked from the left column, while the quote currency is picked from the top row. For example, if you pick the US Dollar from the left column and move along the horizontal line to the Japanese Yen, the percentage change displayed in the box will represent USD (base)/JPY (quote).
![]()
Created
: 2025.09.02
![]()
Last updated
: 2025.09.02

FXStreet is a forex information website, delivering market analysis and news articles 24/7.
It features a number of articles contributed by well-known analysts, in addition to the ones by its editorial team.
Founded in 2000 by Francesc Riverola, a Spanish economist, it has grown to become a world-renowned information website.
We hope you find this article useful. Any comments or suggestions will be greatly appreciated.
We are also looking for writers with extensive experience in forex and crypto to join us.
please contact us at [email protected].
Disclaimer:![]()
All information and content provided on this website is provided for informational purposes only and is not intended to solicit any investment. Although all efforts are made in order to ensure that the information is correct, no guarantee is provided for the accuracy of any content on this website. Any decision made shall be the responsibility of the investor and Myforex does not take any responsibility whatsoever regarding the use of any information provided herein.
The content provided on this website belongs to Myforex and, where stated, the relevant licensors. All rights are reserved by Myforex and the relevant licensors, and no content of this website, whether in full or in part, shall be copied or displayed elsewhere without the explicit written permission of the relevant copyright holder. If you wish to use any part of the content provided on this website, please ensure that you contact Myforex.
Myforex uses cookies to improve the convenience and functionality of this website. This website may include cookies not only by us but also by third parties (advertisers, log analysts, etc.) for the purpose of tracking the activities of users. Cookie policy
