Created
: 2025.08.27


![]() 2025.08.27 11:47
2025.08.27 11:47
The Australian Dollar (AUD) remains steady following the release of the Monthly Consumer Price Index (CPI) on Wednesday. However, the AUD/USD pair receives downward pressure as the US Dollar (USD) recovers its recent losses from the previous session.
Australian Bureau of Statistics (ABS) reported that the Monthly Consumer Price Index jumped by 2.8% year-over-year in July, following a 1.9% increase reported in June. The market consensus was for 2.3% growth in the reported period. Meanwhile, the Australian Construction Work Done improved to 3% in the second quarter, against the 0.8% expected.
Traders remain cautious following US President Donald Trump's warning of imposing a 200% tariff on Chinese goods if Beijing refuses to supply magnets to the United States (US), per Reuters. It is worth noting that any change in the Chinese economy could influence AUD as China and Australia are close trading partners.
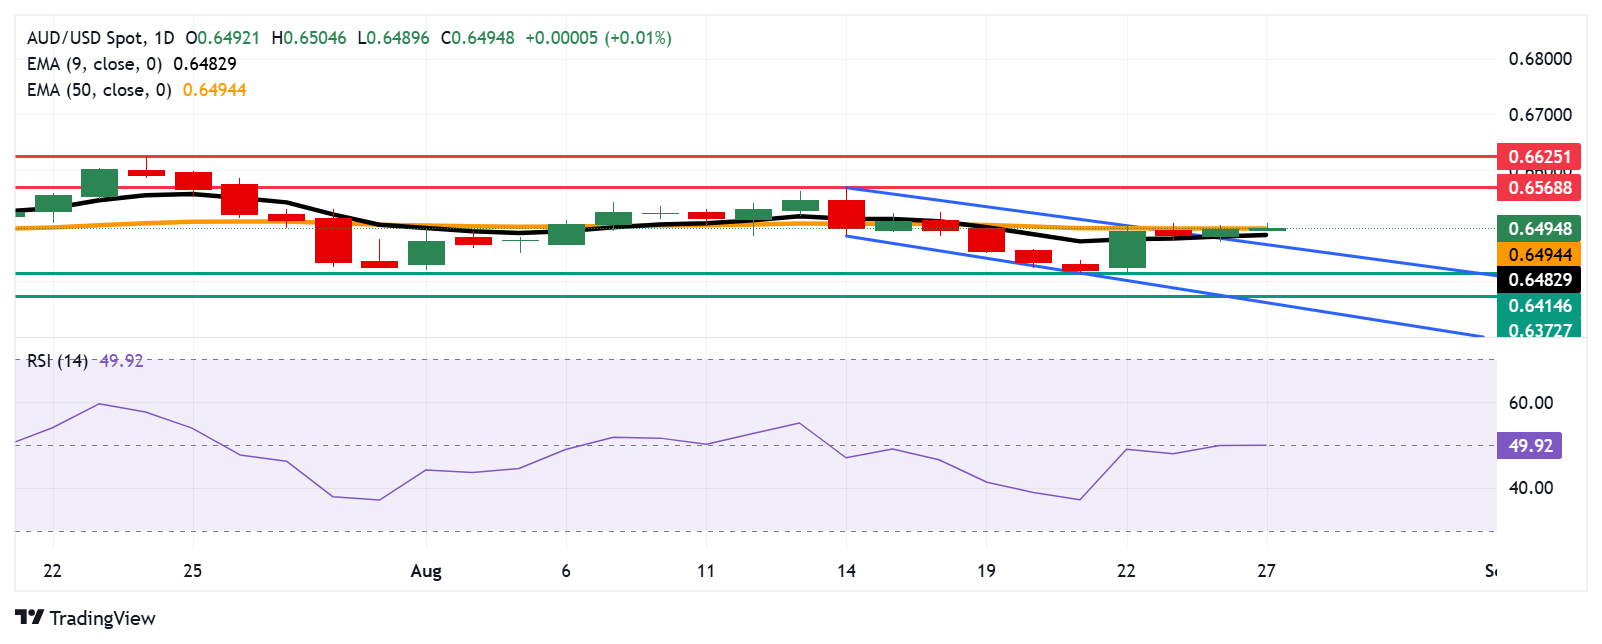
The AUD/USD pair is trading around 0.6500 on Wednesday. The technical analysis of the daily chart indicates that the pair is positioned slightly above the descending channel pattern, suggesting an emergence of a bullish bias. Additionally, the pair is trading above the nine-day EMA, indicating short-term price momentum is strengthening.
On the upside, a successful breach above the psychological level of 0.6500 could support the AUD/JPY pair to explore the region around the monthly high at 0.6568, reached on August 14. Further advances could prompt the pair to test the nine-month high of 0.6625, which was recorded on July 24.
The immediate support is appearing at the 50-day EMA of 0.6494, followed by the nine-day EMA of 0.6482. A break below these levels would weaken the medium- and short-term price momentum and put downward pressure on the pair to return to the descending channel and target the two-month low of 0.6414, recorded on August 21. Further declines would find support near the three-month low of 0.6372, reached on June 23, followed by the descending channel's lower boundary.
The table below shows the percentage change of Australian Dollar (AUD) against listed major currencies today. Australian Dollar was the strongest against the Japanese Yen.
| USD | EUR | GBP | JPY | CAD | AUD | NZD | CHF | |
|---|---|---|---|---|---|---|---|---|
| USD | 0.14% | 0.15% | 0.27% | 0.02% | 0.06% | 0.18% | 0.10% | |
| EUR | -0.14% | 0.00% | 0.05% | -0.16% | -0.15% | 0.00% | -0.08% | |
| GBP | -0.15% | -0.00% | 0.10% | -0.12% | -0.04% | 0.04% | -0.04% | |
| JPY | -0.27% | -0.05% | -0.10% | -0.19% | -0.20% | -0.08% | -0.08% | |
| CAD | -0.02% | 0.16% | 0.12% | 0.19% | 0.04% | 0.18% | 0.08% | |
| AUD | -0.06% | 0.15% | 0.04% | 0.20% | -0.04% | 0.15% | 0.06% | |
| NZD | -0.18% | -0.00% | -0.04% | 0.08% | -0.18% | -0.15% | -0.08% | |
| CHF | -0.10% | 0.08% | 0.04% | 0.08% | -0.08% | -0.06% | 0.08% |
The heat map shows percentage changes of major currencies against each other. The base currency is picked from the left column, while the quote currency is picked from the top row. For example, if you pick the Australian Dollar from the left column and move along the horizontal line to the US Dollar, the percentage change displayed in the box will represent AUD (base)/USD (quote).
The Monthly Consumer Price Index (CPI), released by the Australian Bureau of Statistics on a monthly basis, measures the changes in the price of a fixed basket of goods and services acquired by household consumers. The indicator was developed to provide inflation data at a higher frequency than the quarterly CPI. The YoY reading compares prices in the reference month to the same month a year earlier. A high reading is seen as bullish for the Australian Dollar (AUD), while a low reading is seen as bearish.
Read more.Last release: Wed Aug 27, 2025 01:30
Frequency: Monthly
Actual: 2.8%
Consensus: 2.3%
Previous: 1.9%
Source: Australian Bureau of Statistics
![]()
Created
: 2025.08.27
![]()
Last updated
: 2025.08.27

FXStreet is a forex information website, delivering market analysis and news articles 24/7.
It features a number of articles contributed by well-known analysts, in addition to the ones by its editorial team.
Founded in 2000 by Francesc Riverola, a Spanish economist, it has grown to become a world-renowned information website.
We hope you find this article useful. Any comments or suggestions will be greatly appreciated.
We are also looking for writers with extensive experience in forex and crypto to join us.
please contact us at [email protected].
Disclaimer:![]()
All information and content provided on this website is provided for informational purposes only and is not intended to solicit any investment. Although all efforts are made in order to ensure that the information is correct, no guarantee is provided for the accuracy of any content on this website. Any decision made shall be the responsibility of the investor and Myforex does not take any responsibility whatsoever regarding the use of any information provided herein.
The content provided on this website belongs to Myforex and, where stated, the relevant licensors. All rights are reserved by Myforex and the relevant licensors, and no content of this website, whether in full or in part, shall be copied or displayed elsewhere without the explicit written permission of the relevant copyright holder. If you wish to use any part of the content provided on this website, please ensure that you contact Myforex.
Myforex uses cookies to improve the convenience and functionality of this website. This website may include cookies not only by us but also by third parties (advertisers, log analysts, etc.) for the purpose of tracking the activities of users. Cookie policy
