Created
: 2025.08.21


![]() 2025.08.21 16:48
2025.08.21 16:48
EUR/JPY steadies after two days of losses, trading around 171.70 during the early European hours on Thursday. The currency cross moves little following the release of HCOB Purchasing Managers' Index (PMI) data from Germany and the Eurozone.
The HCOB Preliminary German Composite Output Index arrived at 50.9 in August vs. 50.6 in July and 50.2 expected. The index was at its highest level in five months. Meanwhile, the Manufacturing PMI improved to 49.9 from 49.1 prior, beating the market consensus of 48.8. Services PMI fell to 50.1, against the expected 50.3 and previous 50.6 readings.
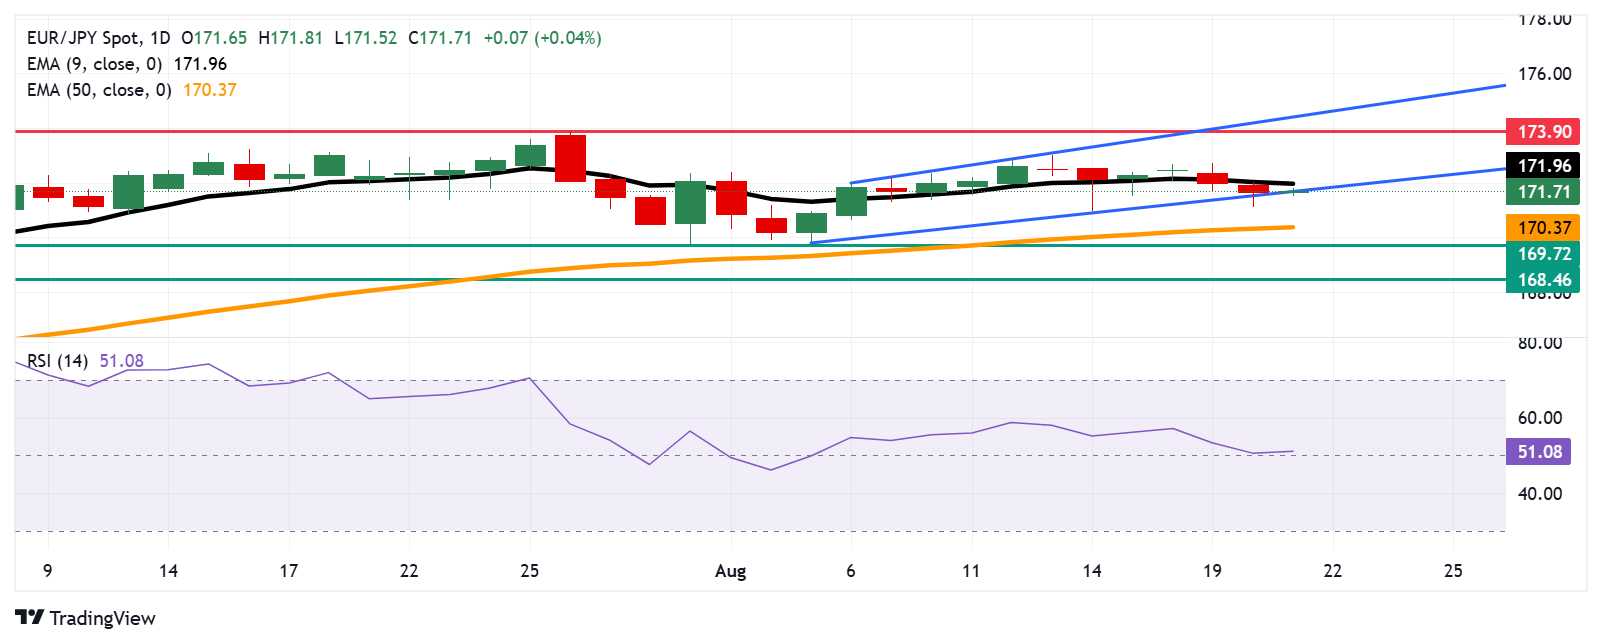
The technical analysis of the daily chart suggests a potential shift from bullish to bearish market bias as the currency cross is testing to break below the ascending channel pattern. The 14-day Relative Strength Index (RSI) is positioned slightly above the 50 mark, suggesting the bullish bias is in play. Further movements will offer a clear directional trend. However, the short-term price momentum is weaker as the EUR/JPY cross remains below the nine-day Exponential Moving Average (EMA).
A successful break below the ascending channel could cause the emergence of the bearish bias and put downward pressure on the EUR/JPY cross to target the 50-day EMA at 170.37, followed by the seven-week low at 169.72, which was recorded on July 31. Further declines would prompt the currency cross to test the two-month low at 168.46, registered on July 1.
On the upside, the immediate barrier appears at the nine-day EMA of 171.96, aligned with the psychological level of 172.00. A break above this crucial resistance zone would reinforce the bullish bias and support the currency cross to explore the region around 173.90, the highest since July 2024, recorded on July 28, 2025, followed by the upper boundary of the ascending channel around 174.50.
The table below shows the percentage change of Euro (EUR) against listed major currencies today. Euro was the strongest against the Australian Dollar.
| USD | EUR | GBP | JPY | CAD | AUD | NZD | CHF | |
|---|---|---|---|---|---|---|---|---|
| USD | -0.05% | 0.03% | 0.16% | 0.04% | 0.15% | -0.01% | 0.13% | |
| EUR | 0.05% | 0.04% | 0.21% | 0.07% | 0.26% | 0.07% | 0.17% | |
| GBP | -0.03% | -0.04% | 0.14% | 0.03% | 0.22% | 0.03% | 0.13% | |
| JPY | -0.16% | -0.21% | -0.14% | -0.10% | 0.02% | -0.12% | 0.03% | |
| CAD | -0.04% | -0.07% | -0.03% | 0.10% | 0.08% | -0.07% | 0.09% | |
| AUD | -0.15% | -0.26% | -0.22% | -0.02% | -0.08% | -0.10% | -0.00% | |
| NZD | 0.01% | -0.07% | -0.03% | 0.12% | 0.07% | 0.10% | 0.09% | |
| CHF | -0.13% | -0.17% | -0.13% | -0.03% | -0.09% | 0.00% | -0.09% |
The heat map shows percentage changes of major currencies against each other. The base currency is picked from the left column, while the quote currency is picked from the top row. For example, if you pick the Euro from the left column and move along the horizontal line to the US Dollar, the percentage change displayed in the box will represent EUR (base)/USD (quote).
![]()
Created
: 2025.08.21
![]()
Last updated
: 2025.08.21

FXStreet is a forex information website, delivering market analysis and news articles 24/7.
It features a number of articles contributed by well-known analysts, in addition to the ones by its editorial team.
Founded in 2000 by Francesc Riverola, a Spanish economist, it has grown to become a world-renowned information website.
We hope you find this article useful. Any comments or suggestions will be greatly appreciated.
We are also looking for writers with extensive experience in forex and crypto to join us.
please contact us at [email protected].
Disclaimer:![]()
All information and content provided on this website is provided for informational purposes only and is not intended to solicit any investment. Although all efforts are made in order to ensure that the information is correct, no guarantee is provided for the accuracy of any content on this website. Any decision made shall be the responsibility of the investor and Myforex does not take any responsibility whatsoever regarding the use of any information provided herein.
The content provided on this website belongs to Myforex and, where stated, the relevant licensors. All rights are reserved by Myforex and the relevant licensors, and no content of this website, whether in full or in part, shall be copied or displayed elsewhere without the explicit written permission of the relevant copyright holder. If you wish to use any part of the content provided on this website, please ensure that you contact Myforex.
Myforex uses cookies to improve the convenience and functionality of this website. This website may include cookies not only by us but also by third parties (advertisers, log analysts, etc.) for the purpose of tracking the activities of users. Cookie policy
