Created
: 2025.08.21


![]() 2025.08.21 12:49
2025.08.21 12:49
Gold (XAU/USD) meets with some supply during the Asian session on Thursday and stalls the previous day's goodish recovery from the $3,312-3,311 area, or a nearly three-week low. Minutes from the late July FOMC policy meeting released on Wednesday read on the hawkish side, with participants more worried about inflation than the labour market. This further tempers bets for a jumbo interest rate cut by the Federal Reserve (Fed) in September, which acts as a tailwind for the US Dollar (USD) and drives some flows away from the non-yielding yellow metal.
Adding to this, the optimism over a possible agreement to end the protracted Russia-Ukraine conflict turns out to be another factor that undermines demand for the safe-haven Gold. Meanwhile, US President Donald Trump's calls on Fed Governor Lisa Cook to resign after mortgage fraud allegations raised concerns about the central bank's independence. This might hold back the USD bulls from placing aggressive bets and support the bullion. Traders now look to the flash global PMIs for some impetus ahead of Fed Chair Jerome Powell's speech at the Jackson Hole Symposium.
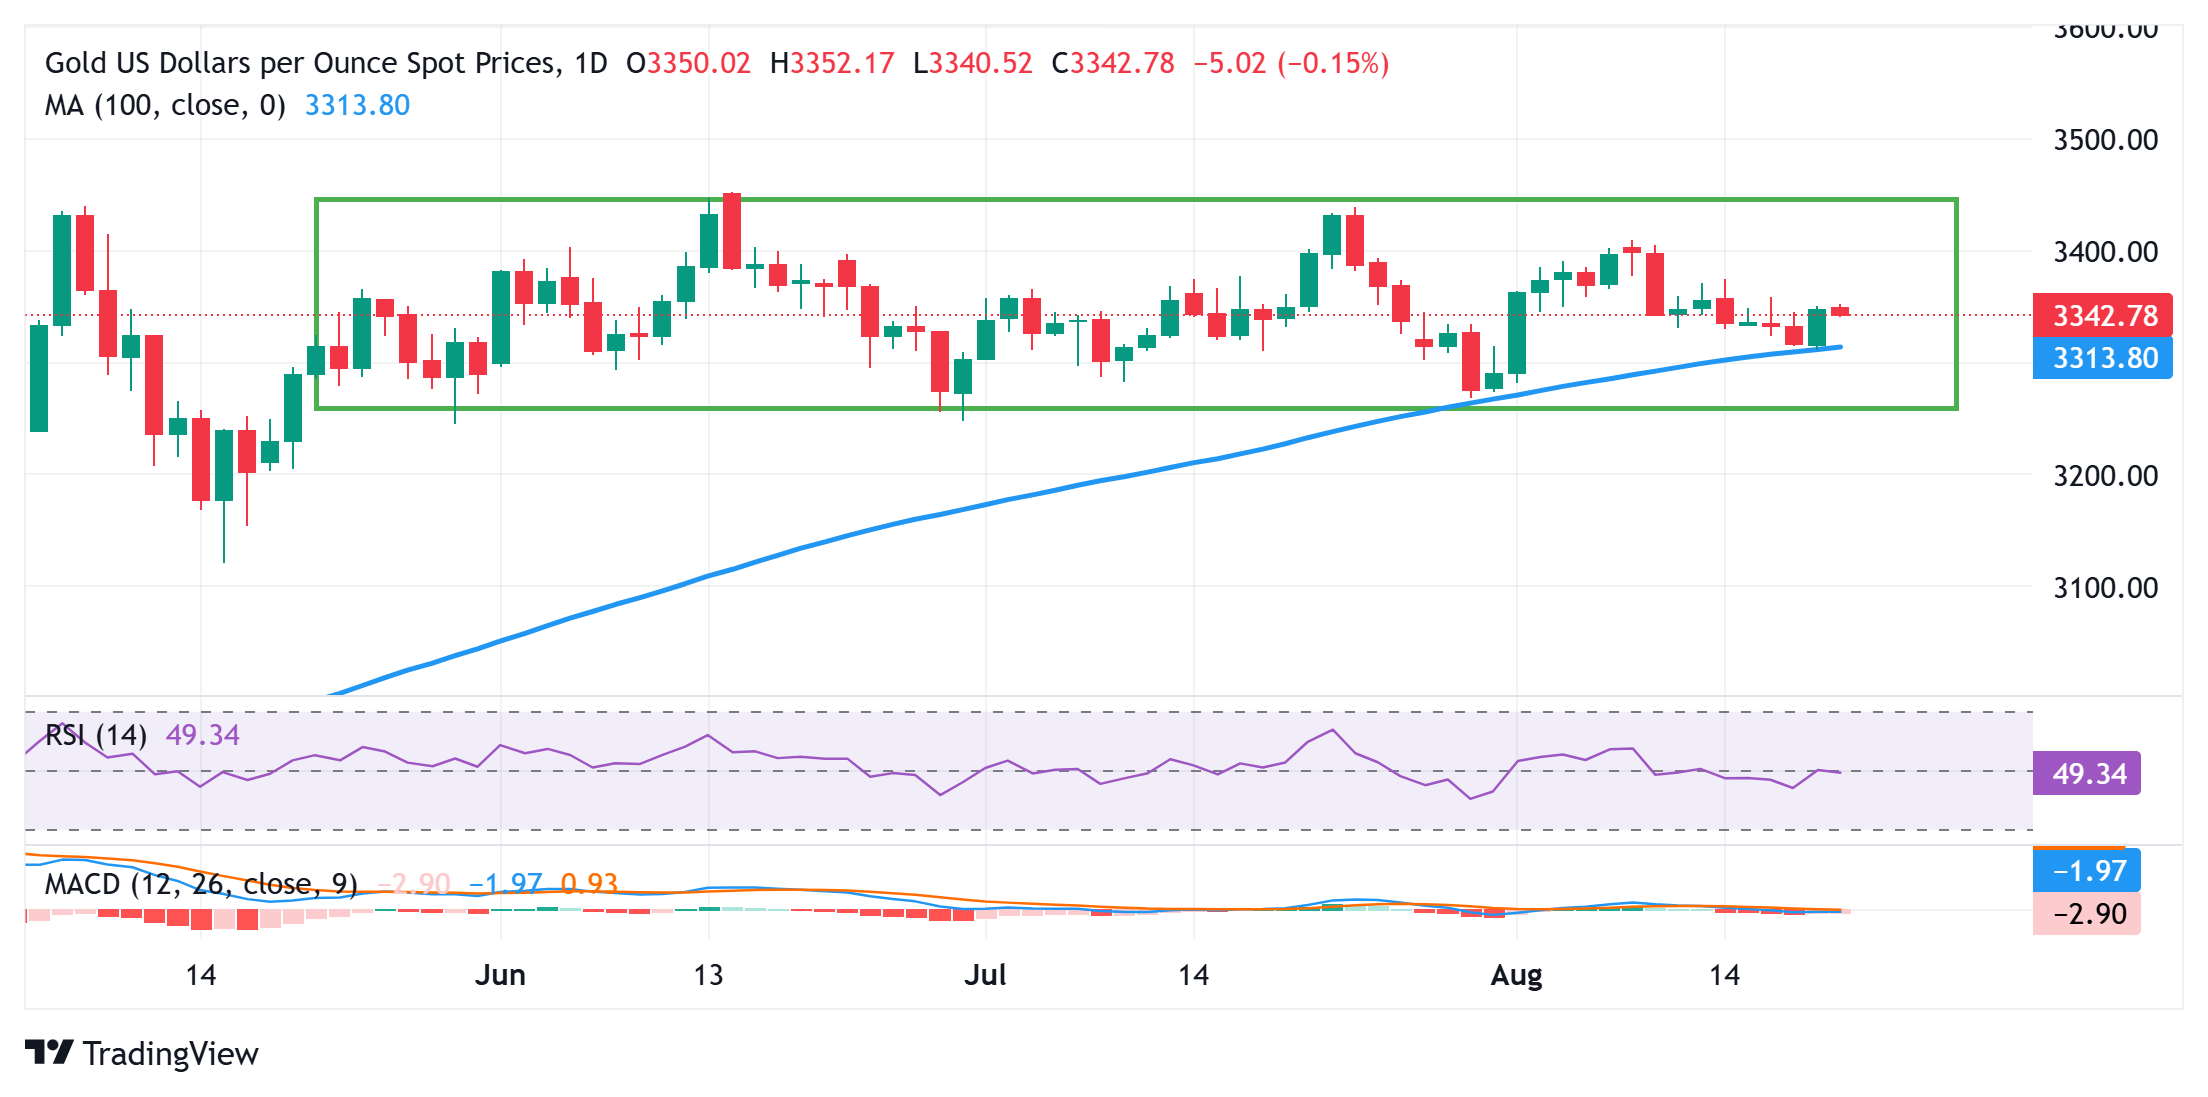
The overnight recovery move reaffirmed the 100-day Simple Moving Average (SMA) pivotal support near the $3,312-3,311 area, which should continue to protect the immediate downside. A convincing break below, however, might prompt some technical selling and drag the Gold price below the $3,300 mark, towards the $3,270-3,265 strong horizontal support. The latter represents the lower boundary of a three-month-old trading range, which, if broken, will suggest that the commodity has topped out and pave the way for a further near-term depreciating move.
On the flip side, sustained strength beyond the Asian session peak, around the $3,352 region, might trigger a short-covering rally and lift the Gold price to the $3,375 intermediate hurdle en route to the $3,400 mark. Some follow-through buying would set the stage for an extension of the momentum towards challenging the $3,434-3,435 heavy supply zone, also marking the top boundary of a multi-month-old trading range.
The table below shows the percentage change of US Dollar (USD) against listed major currencies this week. US Dollar was the strongest against the New Zealand Dollar.
| USD | EUR | GBP | JPY | CAD | AUD | NZD | CHF | |
|---|---|---|---|---|---|---|---|---|
| USD | 0.60% | 0.78% | 0.18% | 0.48% | 1.39% | 1.86% | -0.05% | |
| EUR | -0.60% | 0.17% | -0.45% | -0.13% | 0.80% | 1.22% | -0.64% | |
| GBP | -0.78% | -0.17% | -0.71% | -0.28% | 0.63% | 1.05% | -0.85% | |
| JPY | -0.18% | 0.45% | 0.71% | 0.33% | 1.25% | 1.72% | -0.21% | |
| CAD | -0.48% | 0.13% | 0.28% | -0.33% | 0.90% | 1.38% | -0.56% | |
| AUD | -1.39% | -0.80% | -0.63% | -1.25% | -0.90% | 0.42% | -1.47% | |
| NZD | -1.86% | -1.22% | -1.05% | -1.72% | -1.38% | -0.42% | -1.91% | |
| CHF | 0.05% | 0.64% | 0.85% | 0.21% | 0.56% | 1.47% | 1.91% |
The heat map shows percentage changes of major currencies against each other. The base currency is picked from the left column, while the quote currency is picked from the top row. For example, if you pick the US Dollar from the left column and move along the horizontal line to the Japanese Yen, the percentage change displayed in the box will represent USD (base)/JPY (quote).
![]()
Created
: 2025.08.21
![]()
Last updated
: 2025.08.21

FXStreet is a forex information website, delivering market analysis and news articles 24/7.
It features a number of articles contributed by well-known analysts, in addition to the ones by its editorial team.
Founded in 2000 by Francesc Riverola, a Spanish economist, it has grown to become a world-renowned information website.
We hope you find this article useful. Any comments or suggestions will be greatly appreciated.
We are also looking for writers with extensive experience in forex and crypto to join us.
please contact us at [email protected].
Disclaimer:![]()
All information and content provided on this website is provided for informational purposes only and is not intended to solicit any investment. Although all efforts are made in order to ensure that the information is correct, no guarantee is provided for the accuracy of any content on this website. Any decision made shall be the responsibility of the investor and Myforex does not take any responsibility whatsoever regarding the use of any information provided herein.
The content provided on this website belongs to Myforex and, where stated, the relevant licensors. All rights are reserved by Myforex and the relevant licensors, and no content of this website, whether in full or in part, shall be copied or displayed elsewhere without the explicit written permission of the relevant copyright holder. If you wish to use any part of the content provided on this website, please ensure that you contact Myforex.
Myforex uses cookies to improve the convenience and functionality of this website. This website may include cookies not only by us but also by third parties (advertisers, log analysts, etc.) for the purpose of tracking the activities of users. Cookie policy
