Created
: 2025.08.20


![]() 2025.08.20 13:14
2025.08.20 13:14
Gold (XAU/USD) hits a nearly three-week low during the Asian session on Wednesday, with the bears now awaiting a sustained break below the 100-day Simple Moving Average (SMA) before positioning for further losses. The US Dollar (USD) is seen prolonging its steady uptrend for the third straight day amid diminishing odds for a more aggressive policy easing by the Federal Reserve (Fed). This, in turn, is seen as a key factor undermining the non-yielding bullion.
Apart from this, hopes for a Russia-Ukraine peace deal exert additional downward pressure on the safe-haven Gold. Moving ahead, investors now look to the release of the FOMC meeting Minutes. Furthermore, Fed Chair Jerome Powell's speech at the Jackson Hole Symposium could offer fresh cues about the central bank's policy outlook. This will play a key role in driving the USD demand in the near term and determining the next leg of a directional move for the commodity.
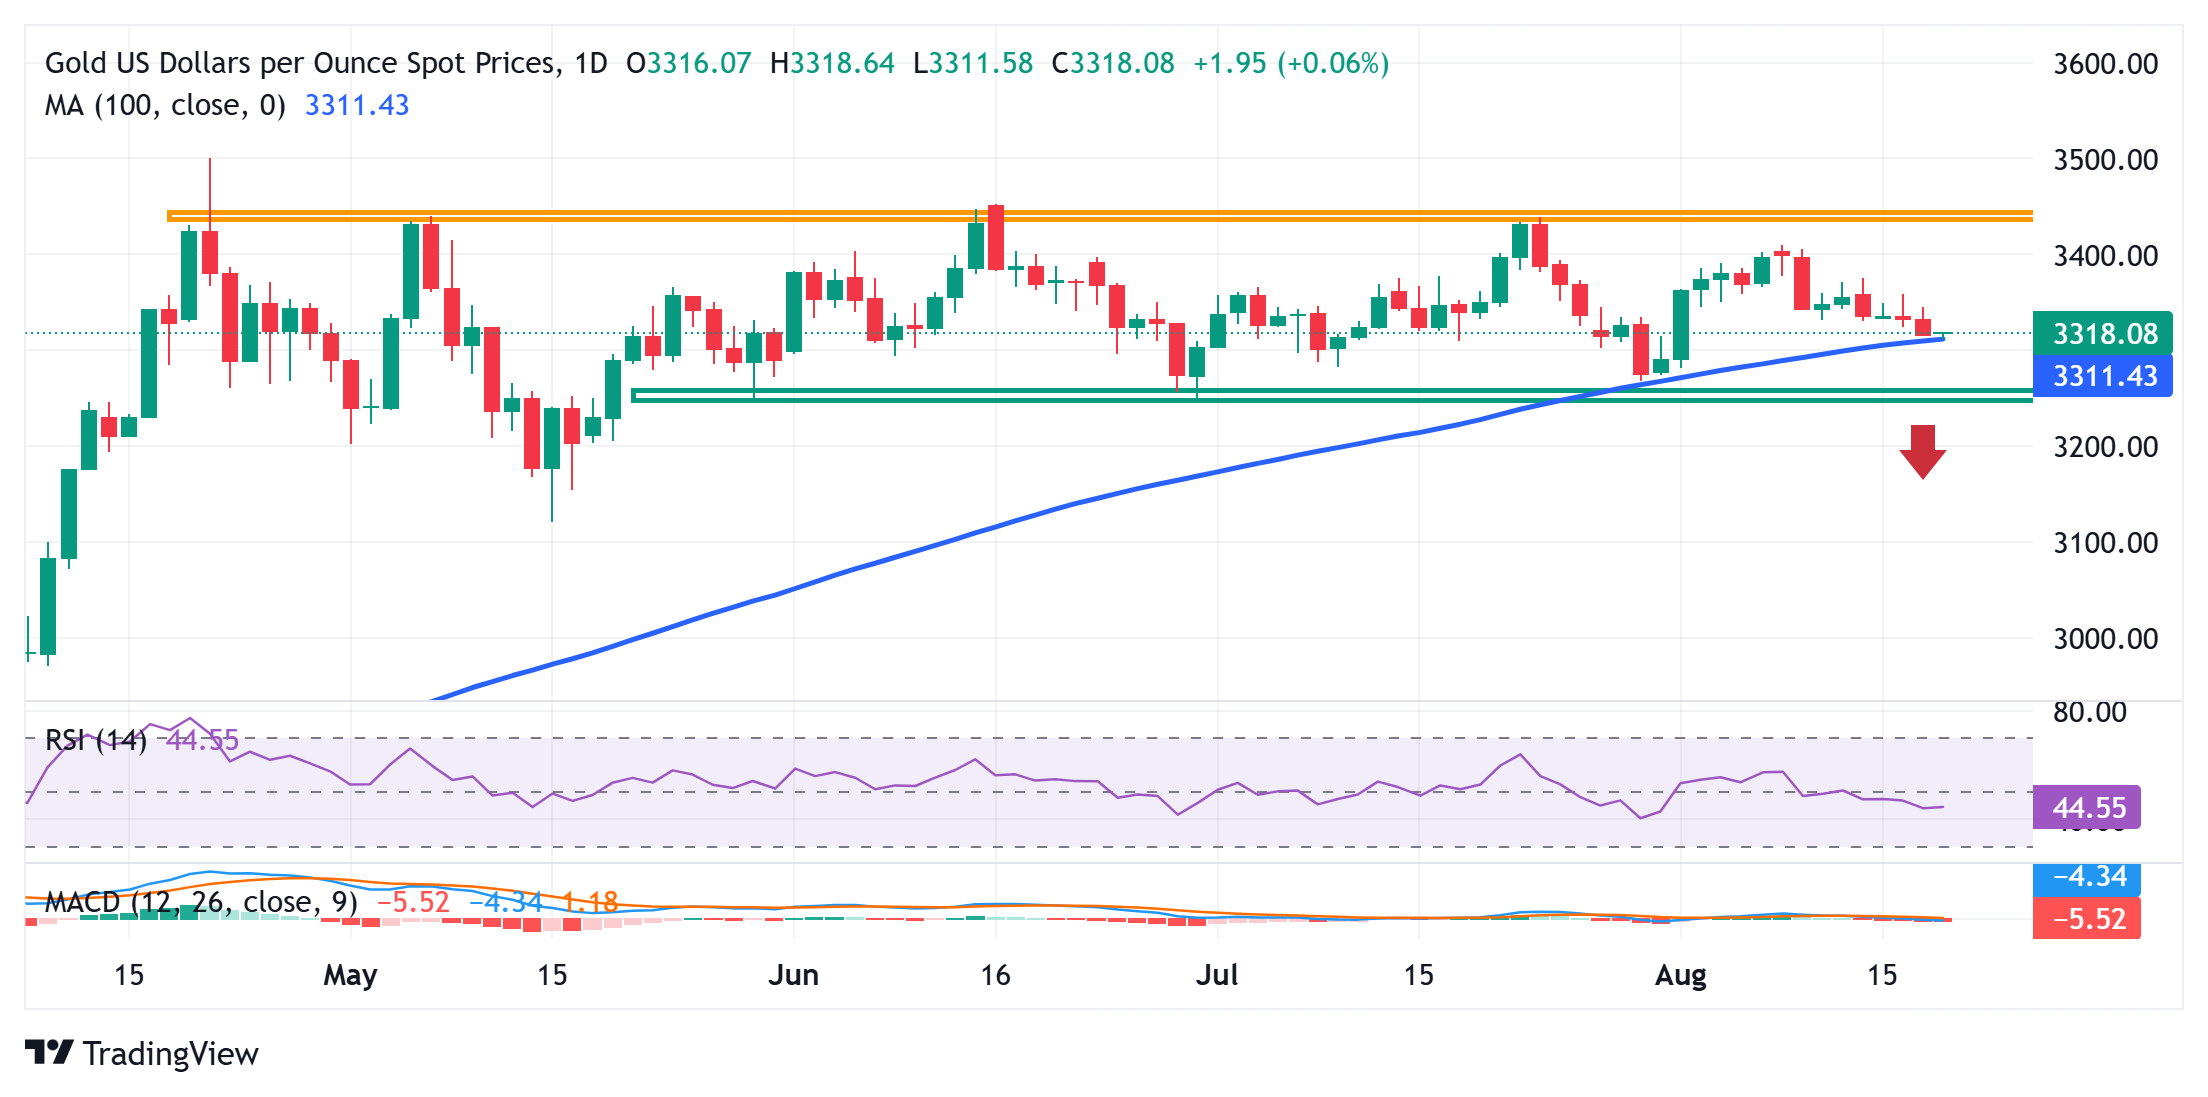
A further slide below the 100-day SMA for the first time since December 2024 will be seen as a fresh trigger for the XAU/USD bears. Given that oscillators on the daily chart have just started gaining negative traction, the Gold price might then accelerate the fall below the $3,300 mark and test the $3,270-3,265 strong horizontal support. The latter represents the lower boundary of a three-month-old trading range and should act as a key pivotal point. A convincing break below will suggest that the commodity has topped out and pave the way for a further near-term depreciating move.
On the flip side, any attempted recovery might now confront an immediate hurdle near the $3,335 region. This is followed by the weekly peak, around the $3,358 zone, which, if cleared, might trigger a short-covering rally and lift the Gold price to the $3,375 intermediate hurdle en route to the $3,400 mark. Some follow-through buying would set the stage for an extension of the momentum towards challenging the $3,434-3,435 heavy supply zone, also marking the top boundary of a multi-month-old trading range.
The table below shows the percentage change of US Dollar (USD) against listed major currencies this week. US Dollar was the strongest against the New Zealand Dollar.
| USD | EUR | GBP | JPY | CAD | AUD | NZD | CHF | |
|---|---|---|---|---|---|---|---|---|
| USD | 0.69% | 0.59% | 0.22% | 0.43% | 1.14% | 1.58% | 0.34% | |
| EUR | -0.69% | -0.10% | -0.48% | -0.26% | 0.46% | 0.85% | -0.34% | |
| GBP | -0.59% | 0.10% | -0.46% | -0.15% | 0.57% | 0.95% | -0.28% | |
| JPY | -0.22% | 0.48% | 0.46% | 0.23% | 0.94% | 1.38% | 0.12% | |
| CAD | -0.43% | 0.26% | 0.15% | -0.23% | 0.69% | 1.14% | -0.12% | |
| AUD | -1.14% | -0.46% | -0.57% | -0.94% | -0.69% | 0.38% | -0.84% | |
| NZD | -1.58% | -0.85% | -0.95% | -1.38% | -1.14% | -0.38% | -1.25% | |
| CHF | -0.34% | 0.34% | 0.28% | -0.12% | 0.12% | 0.84% | 1.25% |
The heat map shows percentage changes of major currencies against each other. The base currency is picked from the left column, while the quote currency is picked from the top row. For example, if you pick the US Dollar from the left column and move along the horizontal line to the Japanese Yen, the percentage change displayed in the box will represent USD (base)/JPY (quote).
![]()
Created
: 2025.08.20
![]()
Last updated
: 2025.08.20

FXStreet is a forex information website, delivering market analysis and news articles 24/7.
It features a number of articles contributed by well-known analysts, in addition to the ones by its editorial team.
Founded in 2000 by Francesc Riverola, a Spanish economist, it has grown to become a world-renowned information website.
We hope you find this article useful. Any comments or suggestions will be greatly appreciated.
We are also looking for writers with extensive experience in forex and crypto to join us.
please contact us at [email protected].
Disclaimer:![]()
All information and content provided on this website is provided for informational purposes only and is not intended to solicit any investment. Although all efforts are made in order to ensure that the information is correct, no guarantee is provided for the accuracy of any content on this website. Any decision made shall be the responsibility of the investor and Myforex does not take any responsibility whatsoever regarding the use of any information provided herein.
The content provided on this website belongs to Myforex and, where stated, the relevant licensors. All rights are reserved by Myforex and the relevant licensors, and no content of this website, whether in full or in part, shall be copied or displayed elsewhere without the explicit written permission of the relevant copyright holder. If you wish to use any part of the content provided on this website, please ensure that you contact Myforex.
Myforex uses cookies to improve the convenience and functionality of this website. This website may include cookies not only by us but also by third parties (advertisers, log analysts, etc.) for the purpose of tracking the activities of users. Cookie policy
