Created
: 2025.07.29


![]() 2025.07.29 16:42
2025.07.29 16:42
The NZD/USD pair extends its losing streak for the fourth trading day against the US Dollar (USD) on Tuesday, sliding to near 0.5950. The Kiwi pair continues to face selling pressure as the US Dollar (USD) trades strongly after the announcement of a trade deal between the United States (US) and the European Union (EU).
The US Dollar Index (DXY), which tracks the Greenback's value against six major currencies, jumps to near 99.00 during the European trading session, the highest level seen in a month.
The table below shows the percentage change of US Dollar (USD) against listed major currencies today. US Dollar was the strongest against the New Zealand Dollar.
| USD | EUR | GBP | JPY | CAD | AUD | NZD | CHF | |
|---|---|---|---|---|---|---|---|---|
| USD | 0.43% | 0.29% | 0.10% | 0.15% | 0.30% | 0.49% | 0.36% | |
| EUR | -0.43% | -0.16% | -0.33% | -0.28% | -0.12% | -0.06% | -0.05% | |
| GBP | -0.29% | 0.16% | -0.20% | -0.12% | 0.04% | 0.11% | 0.09% | |
| JPY | -0.10% | 0.33% | 0.20% | 0.01% | 0.18% | 0.29% | 0.35% | |
| CAD | -0.15% | 0.28% | 0.12% | -0.01% | 0.09% | 0.33% | 0.21% | |
| AUD | -0.30% | 0.12% | -0.04% | -0.18% | -0.09% | 0.08% | 0.04% | |
| NZD | -0.49% | 0.06% | -0.11% | -0.29% | -0.33% | -0.08% | -0.02% | |
| CHF | -0.36% | 0.05% | -0.09% | -0.35% | -0.21% | -0.04% | 0.02% |
The heat map shows percentage changes of major currencies against each other. The base currency is picked from the left column, while the quote currency is picked from the top row. For example, if you pick the US Dollar from the left column and move along the horizontal line to the Japanese Yen, the percentage change displayed in the box will represent USD (base)/JPY (quote).
Meanwhile, investors shift their focus to the Federal Reserve's (Fed) monetary policy announcement on Wednesday. According to the CME FedWatch tool, traders are confident that the Fed will leave interest rates steady in the current range of 4.25%-4.50% for the fifth time in a row.
On the global front, investors await the outcome of high-stakes trade talks between the US and China. A report from the South China Morning Post (SCMP) showed on Monday that Washington and Beijing are expected to "extend their tariff truce for 90 days", which will expire on August 12.
Signs of improving trade relations between the US and China will be favorable for the New Zealand Dollar (NZD), given that the New Zealand (NZ) economy relies heavily on its exports to Beijing.
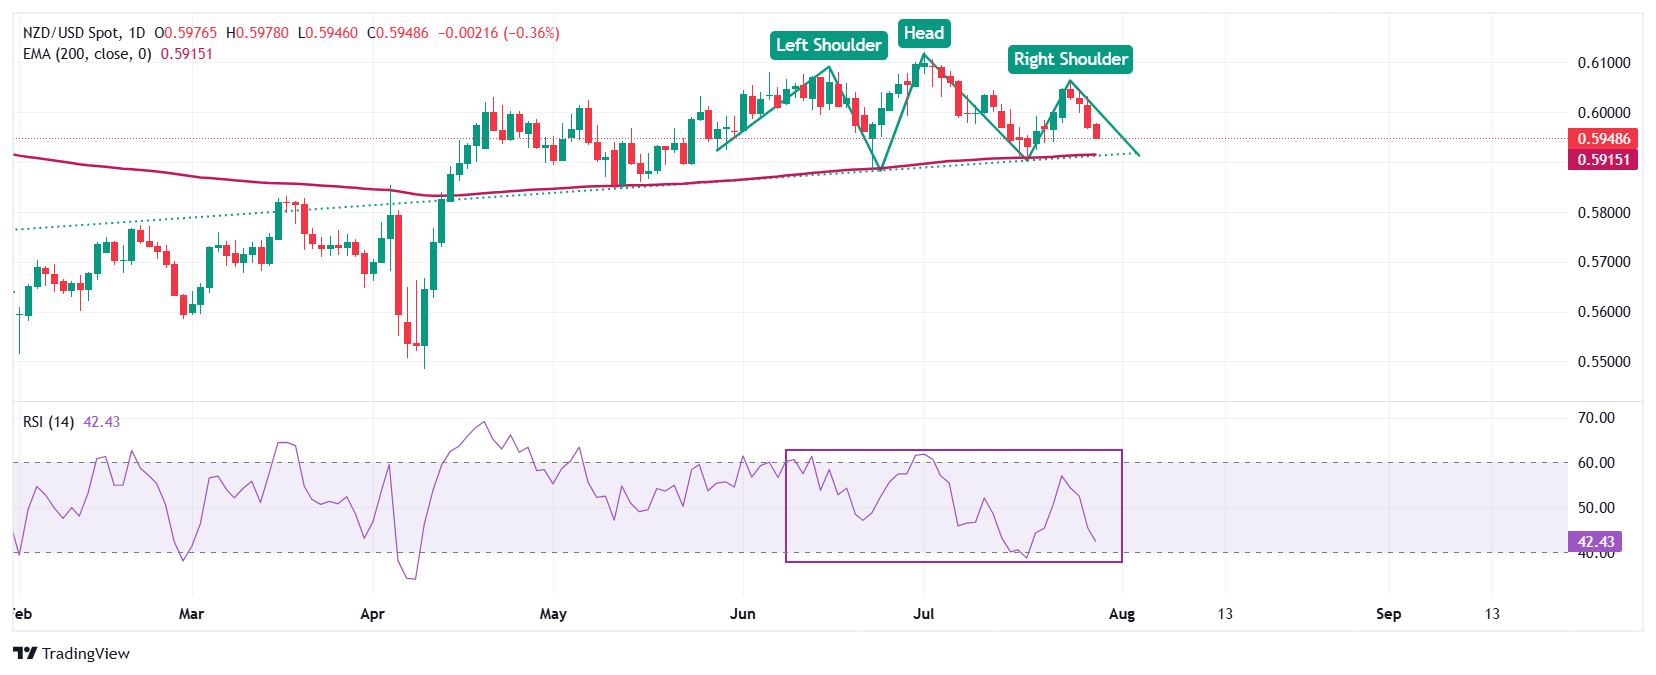
NZD/USD is expected to face more downside amid the formation of the Head and Shoulder (H&S) chart pattern on a daily timeframe. The neckline of the H&S pattern is plotted near 0.5920.
The 200-day Exponential Moving Average (EMA) near 0.5920 still acts as key support for the Kiwi pair.
The 14-day Relative Strength Index (RSI) trades close to 40.00. A fresh bearish momentum would trigger if the RSI falls below that level.
Going forward, a downside move by the pair below the June 23 low of 0.5883 will expose it to the May 12 low of 0.5846, followed by the round-level support of 0.5800.
In an alternate scenario, the Kiwi pair would rise towards the June 19 high of 0.6040 and the September 11 low of 0.6100 if it manages to return above the psychological level of 0.6000.
The US Dollar (USD) is the official currency of the United States of America, and the 'de facto' currency of a significant number of other countries where it is found in circulation alongside local notes. It is the most heavily traded currency in the world, accounting for over 88% of all global foreign exchange turnover, or an average of $6.6 trillion in transactions per day, according to data from 2022. Following the second world war, the USD took over from the British Pound as the world's reserve currency. For most of its history, the US Dollar was backed by Gold, until the Bretton Woods Agreement in 1971 when the Gold Standard went away.
The most important single factor impacting on the value of the US Dollar is monetary policy, which is shaped by the Federal Reserve (Fed). The Fed has two mandates: to achieve price stability (control inflation) and foster full employment. Its primary tool to achieve these two goals is by adjusting interest rates. When prices are rising too quickly and inflation is above the Fed's 2% target, the Fed will raise rates, which helps the USD value. When inflation falls below 2% or the Unemployment Rate is too high, the Fed may lower interest rates, which weighs on the Greenback.
In extreme situations, the Federal Reserve can also print more Dollars and enact quantitative easing (QE). QE is the process by which the Fed substantially increases the flow of credit in a stuck financial system. It is a non-standard policy measure used when credit has dried up because banks will not lend to each other (out of the fear of counterparty default). It is a last resort when simply lowering interest rates is unlikely to achieve the necessary result. It was the Fed's weapon of choice to combat the credit crunch that occurred during the Great Financial Crisis in 2008. It involves the Fed printing more Dollars and using them to buy US government bonds predominantly from financial institutions. QE usually leads to a weaker US Dollar.
Quantitative tightening (QT) is the reverse process whereby the Federal Reserve stops buying bonds from financial institutions and does not reinvest the principal from the bonds it holds maturing in new purchases. It is usually positive for the US Dollar.
![]()
Created
: 2025.07.29
![]()
Last updated
: 2025.07.29

FXStreet is a forex information website, delivering market analysis and news articles 24/7.
It features a number of articles contributed by well-known analysts, in addition to the ones by its editorial team.
Founded in 2000 by Francesc Riverola, a Spanish economist, it has grown to become a world-renowned information website.
We hope you find this article useful. Any comments or suggestions will be greatly appreciated.
We are also looking for writers with extensive experience in forex and crypto to join us.
please contact us at [email protected].
Disclaimer:![]()
All information and content provided on this website is provided for informational purposes only and is not intended to solicit any investment. Although all efforts are made in order to ensure that the information is correct, no guarantee is provided for the accuracy of any content on this website. Any decision made shall be the responsibility of the investor and Myforex does not take any responsibility whatsoever regarding the use of any information provided herein.
The content provided on this website belongs to Myforex and, where stated, the relevant licensors. All rights are reserved by Myforex and the relevant licensors, and no content of this website, whether in full or in part, shall be copied or displayed elsewhere without the explicit written permission of the relevant copyright holder. If you wish to use any part of the content provided on this website, please ensure that you contact Myforex.
Myforex uses cookies to improve the convenience and functionality of this website. This website may include cookies not only by us but also by third parties (advertisers, log analysts, etc.) for the purpose of tracking the activities of users. Cookie policy
