Created
: 2025.07.23


![]() 2025.07.23 14:07
2025.07.23 14:07
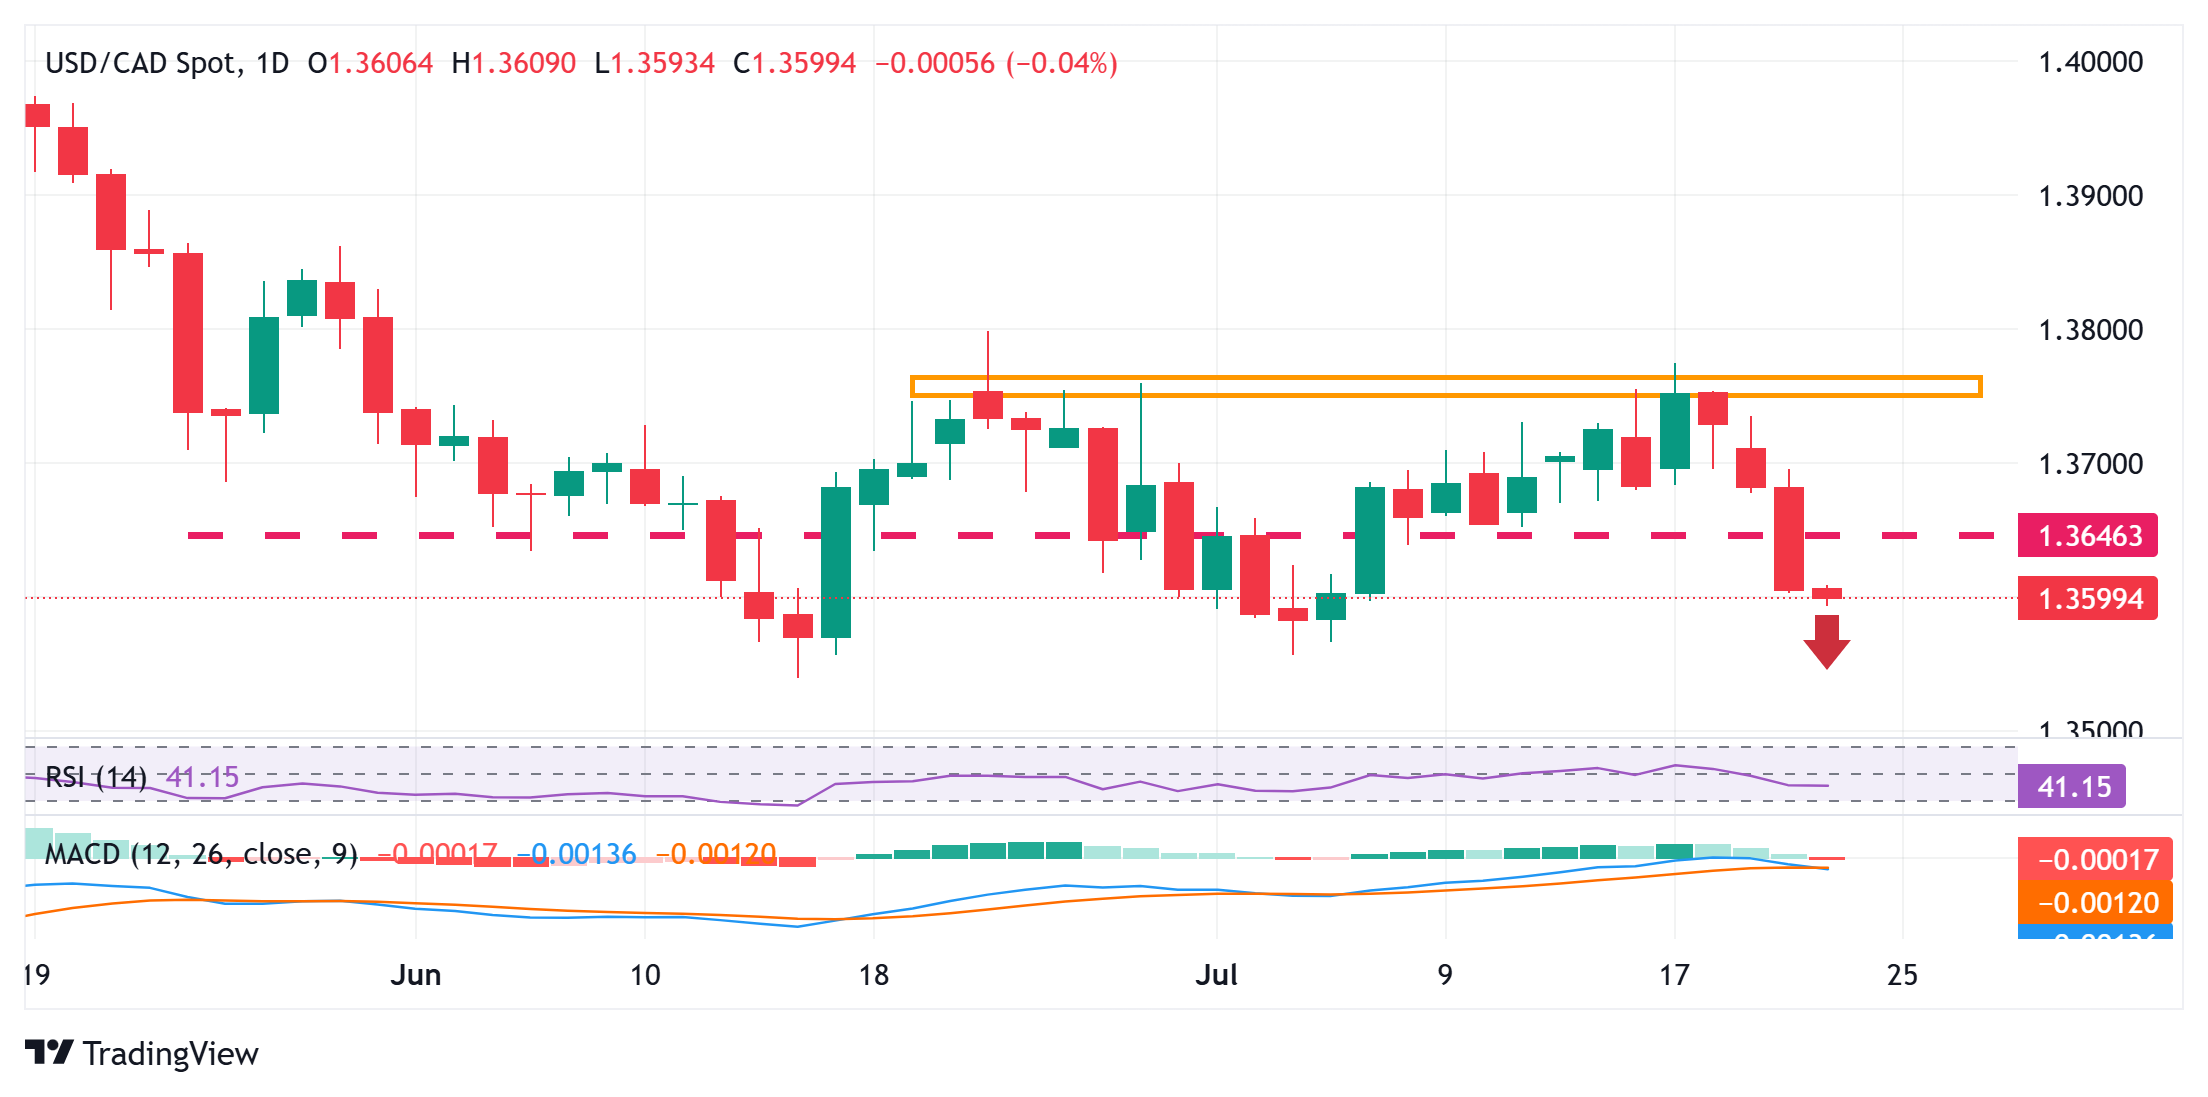
The USD/CAD pair enters a bearish consolidation phase during the Asian session and oscillates in a narrow trading band around the 1.3600 mark, near a two-week low touched earlier this Wednesday.
From a technical perspective, the overnight breakdown below the 1.3650 horizontal support was seen as a fresh trigger for the USD/CAD bears. Moreover, oscillators on the daily chart have just started gaining negative traction and suggest that the path of least resistance for spot prices remains to the downside. Some follow-through selling below the 1.3575 horizontal support will reaffirm the negative bias and expose the year-to-date low, around the 1.3540-1.3535 region touched in June.
The downward trajectory could extend further towards the 1.3500 psychological mark. A convincing break below the latter would set the stage for the resumption of the prior well-established descending trend from the vicinity of the 1.4800 mark, or over a two-decade high touched in February.
On the flip side, any attempted recovery might now confront immediate resistance near the 1.3650 support breakpoint. A further move up could be seen as a selling opportunity and remain capped near the 1.3700 round figure. A sustained strength beyond the latter, however, might trigger a short-covering rally and lift the USD/CAD pair to the monthly swing high, around the 1.3775 zone. Some follow-through buying might then negate the negative outlook and pave the way for additional gains.
The table below shows the percentage change of US Dollar (USD) against listed major currencies this week. US Dollar was the strongest against the Japanese Yen.
| USD | EUR | GBP | JPY | CAD | AUD | NZD | CHF | |
|---|---|---|---|---|---|---|---|---|
| USD | -0.89% | -0.82% | -0.71% | -0.85% | -0.78% | -0.74% | -0.95% | |
| EUR | 0.89% | 0.15% | 0.21% | 0.02% | 0.08% | -0.02% | -0.10% | |
| GBP | 0.82% | -0.15% | -0.16% | -0.08% | -0.04% | 0.04% | -0.05% | |
| JPY | 0.71% | -0.21% | 0.16% | -0.15% | -0.04% | -0.09% | -0.09% | |
| CAD | 0.85% | -0.02% | 0.08% | 0.15% | 0.14% | 0.12% | -0.15% | |
| AUD | 0.78% | -0.08% | 0.04% | 0.04% | -0.14% | -0.02% | -0.07% | |
| NZD | 0.74% | 0.02% | -0.04% | 0.09% | -0.12% | 0.02% | -0.10% | |
| CHF | 0.95% | 0.10% | 0.05% | 0.09% | 0.15% | 0.07% | 0.10% |
The heat map shows percentage changes of major currencies against each other. The base currency is picked from the left column, while the quote currency is picked from the top row. For example, if you pick the US Dollar from the left column and move along the horizontal line to the Japanese Yen, the percentage change displayed in the box will represent USD (base)/JPY (quote).
![]()
Created
: 2025.07.23
![]()
Last updated
: 2025.07.23

FXStreet is a forex information website, delivering market analysis and news articles 24/7.
It features a number of articles contributed by well-known analysts, in addition to the ones by its editorial team.
Founded in 2000 by Francesc Riverola, a Spanish economist, it has grown to become a world-renowned information website.
We hope you find this article useful. Any comments or suggestions will be greatly appreciated.
We are also looking for writers with extensive experience in forex and crypto to join us.
please contact us at [email protected].
Disclaimer:![]()
All information and content provided on this website is provided for informational purposes only and is not intended to solicit any investment. Although all efforts are made in order to ensure that the information is correct, no guarantee is provided for the accuracy of any content on this website. Any decision made shall be the responsibility of the investor and Myforex does not take any responsibility whatsoever regarding the use of any information provided herein.
The content provided on this website belongs to Myforex and, where stated, the relevant licensors. All rights are reserved by Myforex and the relevant licensors, and no content of this website, whether in full or in part, shall be copied or displayed elsewhere without the explicit written permission of the relevant copyright holder. If you wish to use any part of the content provided on this website, please ensure that you contact Myforex.
Myforex uses cookies to improve the convenience and functionality of this website. This website may include cookies not only by us but also by third parties (advertisers, log analysts, etc.) for the purpose of tracking the activities of users. Cookie policy
