Created
: 2025.07.16


![]() 2025.07.16 22:21
2025.07.16 22:21
Silver (XAG/USD) is holding firm near the $38.00 level on Wednesday, drawing support after US Producer Price Index (PPI) data for June came in softer than expected. At the time of writing, the metal is trading around $37.90 per ounce.
Silver showed little reaction after the release of the latest US PPI data, which came in softer than expected. Headline PPI was flat in June, showing no monthly growth, compared to the 0.2% increase markets had expected, and down from a 0.3% rise in May. On an annual basis, PPI slowed to 2.3%, also below the 2.5% forecast and the 2.6% reading from the previous month.
Core PPI, which excludes food and energy, was also weaker than expected. It came in at 0.0% MoM, missing the 0.2% forecast and down from 0.1% in May. On a yearly basis, Core PPI eased to 2.6%, compared to 2.7% expected and 3.0% in the previous month.
This follows Tuesday's US Consumer Price Index (CPI) data, which showed headline inflation in line with expectations, but core inflation came in slightly softer. The mix of inflation data has reduced the urgency for rate cuts, keeping the US Dollar under modest pressure while non-yielding assets, such as silver, remain supported.
The metal touched a fresh 14-year high of $39.13 on Monday before retreating slightly as investors booked profits. However, the broader technical setup remains bullish, with buyers still in control amid lingering safe-haven demand and cautious risk sentiment.
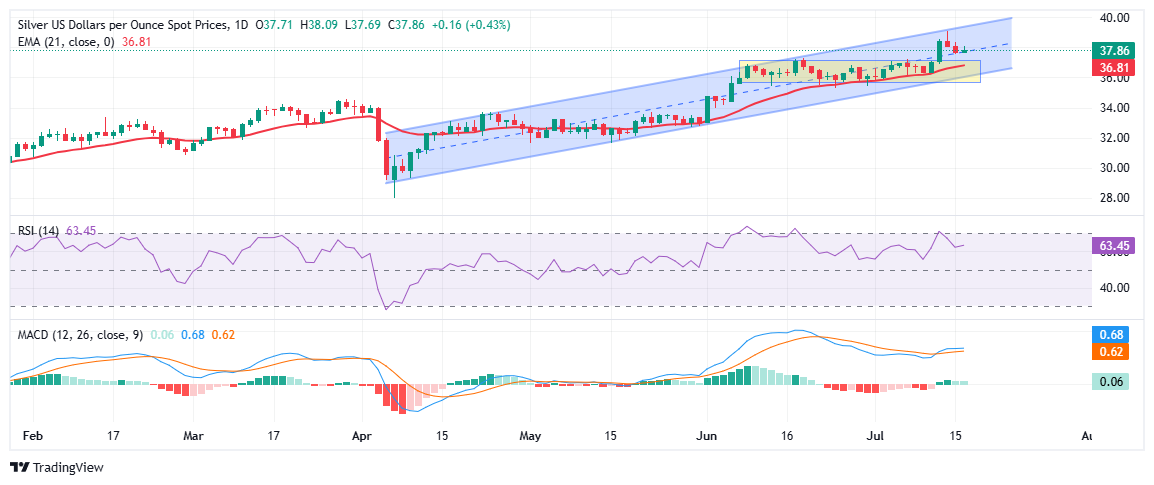
On the daily chart, Silver (XAG/USD) is trading just above the midline of a rising parallel channel that has guided price action since early April. The recent move higher followed a breakout from a multi-week consolidation range between $35.50 and $37.00, which had kept the metal in check through much of June and early July.
The breakout was confirmed by a strong bullish daily candle, propelling Silver toward the channel's upper boundary near $39.00. Following a modest round of profit-taking, the metal has stabilized near the midpoint of the channel, which now serves as dynamic support, suggesting that the uptrend remains intact and well-supported.
The 21-day Exponential Moving Average (EMA) at $36.82 continues to offer key dynamic support and has been consistently respected throughout the current uptrend, reinforcing the underlying bullish structure.
Immediate resistance is seen at the 14-year high of $39.13. A decisive daily close above this level would confirm the next leg of the uptrend and open the door toward the psychological $40.00 mark. If bulls manage to sustain momentum above $40.00, the upper boundary of the rising channel around $40.50 could act as the next upside target.
On the downside, initial support is located at $37.50, which marks the upper boundary of the previous consolidation zone. A break below this level would put focus back on the 21-day EMA at $36.82. Deeper losses may target stronger support near $36.00, aligning with the lower edge of the rising channel.
Momentum indicators continue to favor the bullish scenario. The Relative Strength Index (RSI) has eased slightly from overbought conditions, and now stands near 63.50. This pullback in the RSI indicates a healthy consolidation phase rather than a trend reversal.
At the same time, the Moving Average Convergence Divergence (MACD) remains firmly in positive territory with a steady histogram and no signs of bearish divergence, signaling that upward momentum remains intact.
![]()
Created
: 2025.07.16
![]()
Last updated
: 2025.07.16

FXStreet is a forex information website, delivering market analysis and news articles 24/7.
It features a number of articles contributed by well-known analysts, in addition to the ones by its editorial team.
Founded in 2000 by Francesc Riverola, a Spanish economist, it has grown to become a world-renowned information website.
We hope you find this article useful. Any comments or suggestions will be greatly appreciated.
We are also looking for writers with extensive experience in forex and crypto to join us.
please contact us at [email protected].
Disclaimer:![]()
All information and content provided on this website is provided for informational purposes only and is not intended to solicit any investment. Although all efforts are made in order to ensure that the information is correct, no guarantee is provided for the accuracy of any content on this website. Any decision made shall be the responsibility of the investor and Myforex does not take any responsibility whatsoever regarding the use of any information provided herein.
The content provided on this website belongs to Myforex and, where stated, the relevant licensors. All rights are reserved by Myforex and the relevant licensors, and no content of this website, whether in full or in part, shall be copied or displayed elsewhere without the explicit written permission of the relevant copyright holder. If you wish to use any part of the content provided on this website, please ensure that you contact Myforex.
Myforex uses cookies to improve the convenience and functionality of this website. This website may include cookies not only by us but also by third parties (advertisers, log analysts, etc.) for the purpose of tracking the activities of users. Cookie policy
